1. How to read an ECG
Notes
Introduction
Conduction through the heart is dependent on pacemaker cells, which are organised into key structures.
The heart is a dual pump that sits at the centre of the cardiovascular system. It is composed of both contractile cells and autorhythmic cells (also known as pacemaker cells).
Approximately 1% of cardiac tissue is composed pacemaker cells, which are organised into key structures and can undergo spontaneous depolarisation. Depolarisation refers to the electrical changes that occur within a muscle to allow it to contract. The heart is essentially one big muscle that can contract by itself.
We can detect these electrical changes, which are associated with heart muscle contraction, using an ECG.
Conduction system
The sinoatrial node initiates the electrical impulses that stimulate muscle contraction.
The hearts pacemaker cells are organised into structures including the sinoatrial node (SAN), atrioventricular node (AVN), bundle of His, the right and left bundle branches and Purkinje fibres.
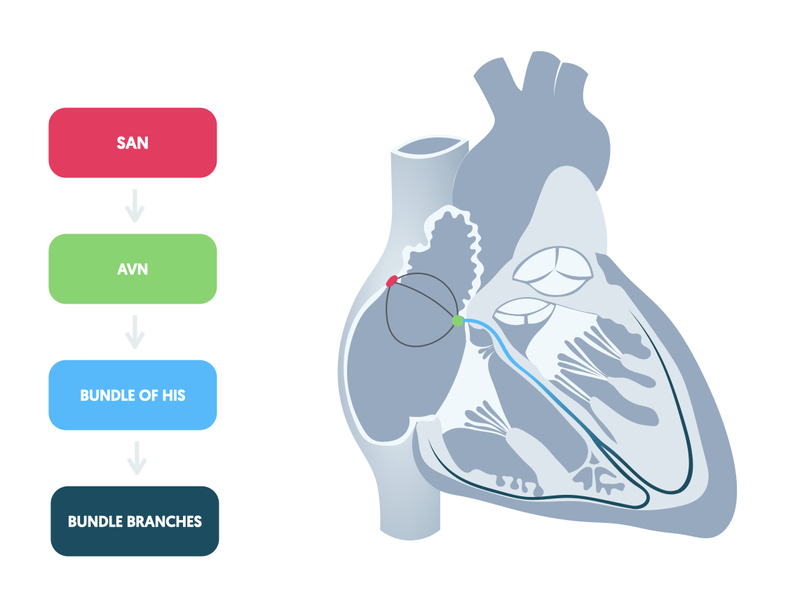
Structural organisation of the hearts pacemaker cells means there is coordinated electrical activity, which leads to a coordinated contraction of both atria and ventricles.
Each structure has an intrinsic rate of autorhythmicity. This refers to the number of electrical signals, and thus contractions, that will occur each minute. Electrical activity starts with the SAN, which has the highest rate of autorhythmicity at 70-100 bpm. Depolarisation of the SAN spread throughout the atria and reaches the AVN. Electrical activity then travels through the bundle of His and bundle branches. Finally it spreads at a slower pace through the ventricular muscle via the Purkinje fibres leading to coordinated ventricular contraction.
For more information see notes on electrophysiology.
Recording an ECG
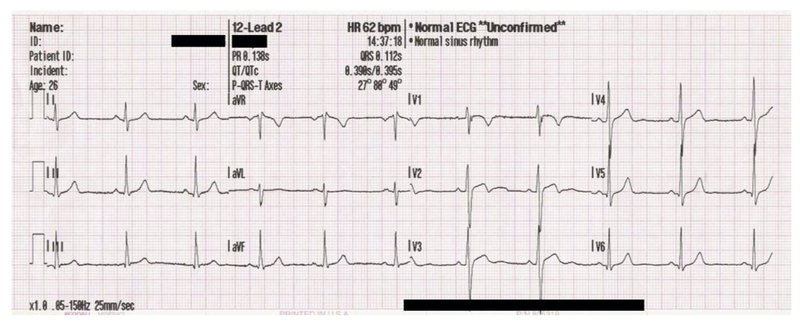
ECG stands for electrocardiogram, which is a visual recording of the electrical activity of the heart.
The ECG is created by attaching a number of electrodes, or leads, to different areas of a patient’s skin. These electrodes can then detect the electrical activity from a variety of angles. This electrical activity is captured and a trace of it is drawn on a moving piece of paper that can be printed off and analysed.
To enable an accurate and reproducible recording of an ECG between patients, ECG machines (and ECG paper) need to be standardised and calibrated appropriately.
Normal ECG
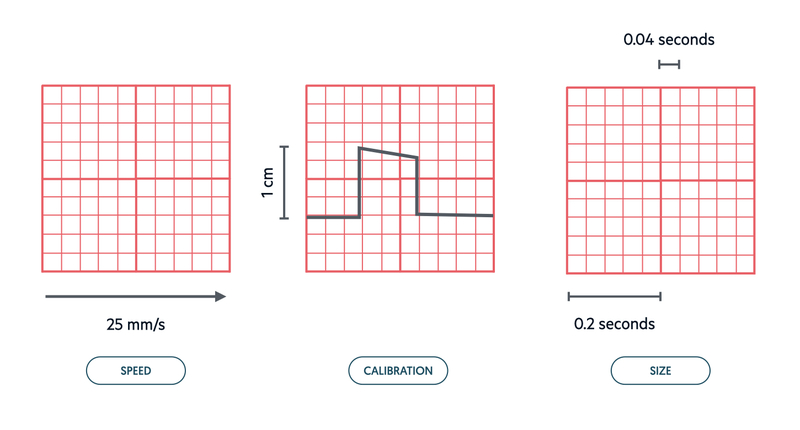
- Standard speed: the speed of tracing on ECG paper. Set at 25 mm/s. Every 5 large squares equals 1 second.
- Standard paper: large square = 5 mm (0.2 seconds). small square = 1 mm (0.04 seconds).
- Calibration: 1 millivolt of electrical activity moves stylus 1 cm on ECG paper
12-lead ECG
A standard 12-lead ECG utilises 10 leads to offer 12 different ‘views’ of the heart.
An 12-lead ECG is recorded by attaching 10 leads (or electrodes) to different areas of skin on a patient. This allows us to visualise the heart from different angles. The word ‘lead’ is often used for both the wires that connect the ECG machine to the patients skin and the electrical picture of the heart.
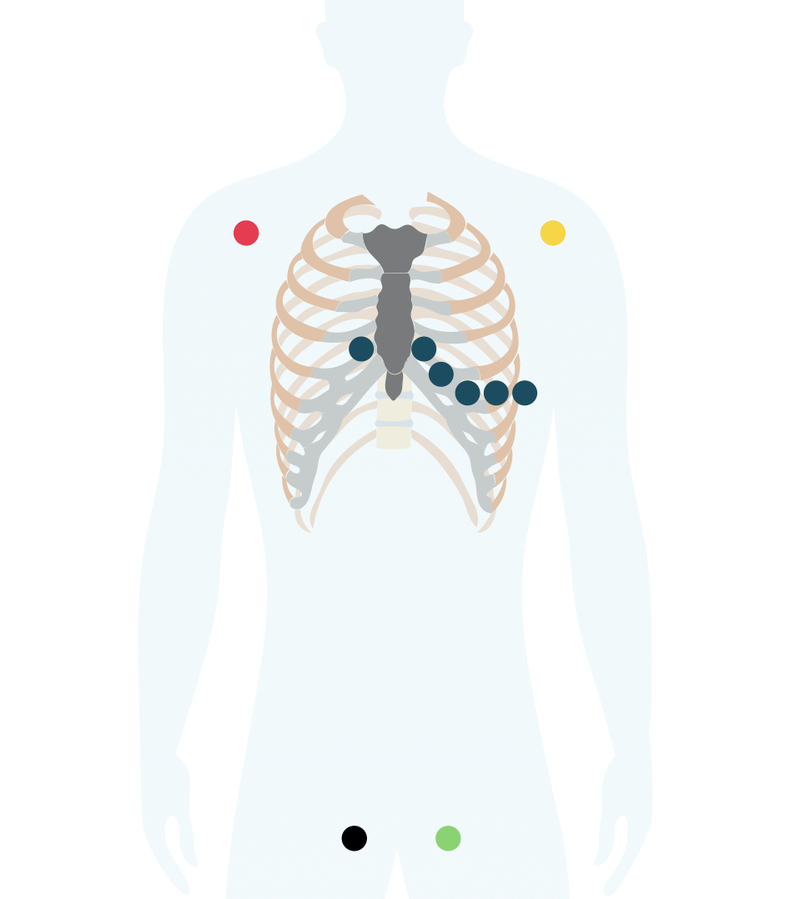
The image shows the standard ECG electrode locations. The ECG recorder compares electrical activity detected from each electrode. This allows formation of an ‘electrical picture’ that views the heart from different positions. Each electrical picture is termed a lead. With a 12-lead ECG we get 12 characteristic views of the heart, which we divide into limb leads and chest leads.
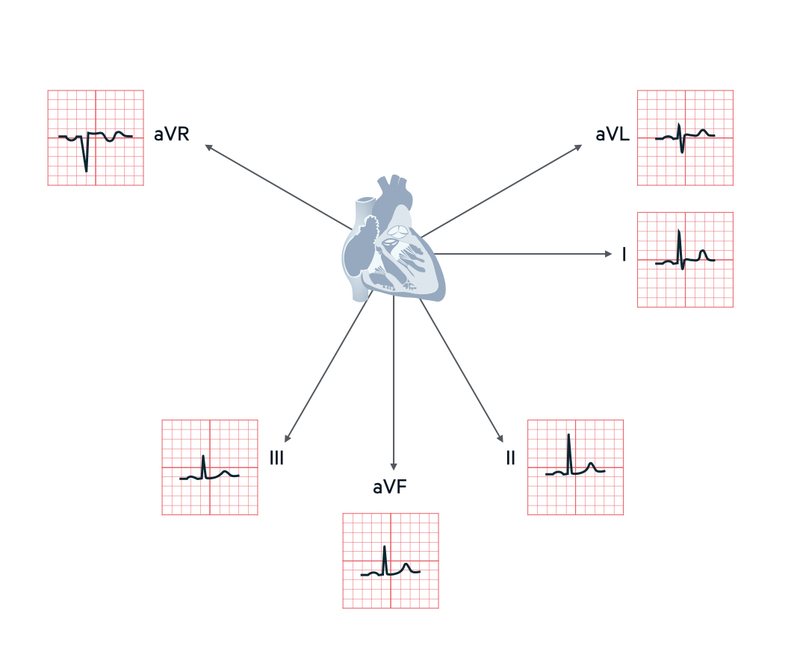
Limb leads
There are six standard limbs leads, which are recorded from the electrodes that attached to the patients limbs. These leads look at the heart from the vertical plane.
- II, III, aVF: inferior leads. Look at the inferior surface of the heart
- I, aVL: lateral leads. Look at the left lateral surface of the heart
- aVR: right arm lead. looks at the right atrium of the heart.
NOTE: due to its location, aVR should always be negative (predominantly negative deflection in QRS complex). If it is positive it may suggest wrong lead placement.
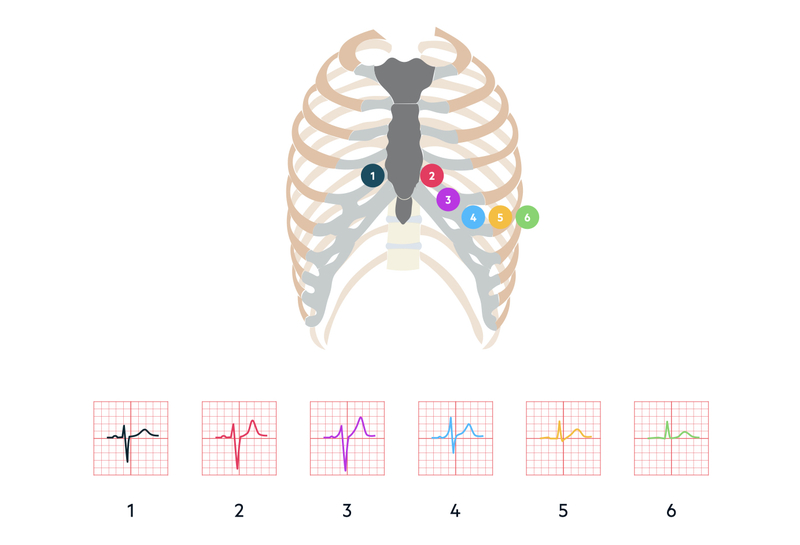
Chest leads
There are six standard chest leads, which are recorded from the electrodes that attach to the patients chest. These leads look at the heart from the horizontal plane.
- V1, V2: septal leads. View the right ventricle of the heart and septum between ventricles.
- V3, V4: anterior leads. View the anterior wall of the left ventricle
- V5, V6: lateral leads. Look at the anterior and lateral wall of the left ventricle.
ECG shape
The shape appearing on a ECG represents the average direction of the wave of depolarisation.
Depolarisation moving towards a lead causes a predominantly upward (or positive) deflection. Depolarisation moving away from a lead causes a predominantly downward (or negative) deflection. The opposite is seen with repolarisation.
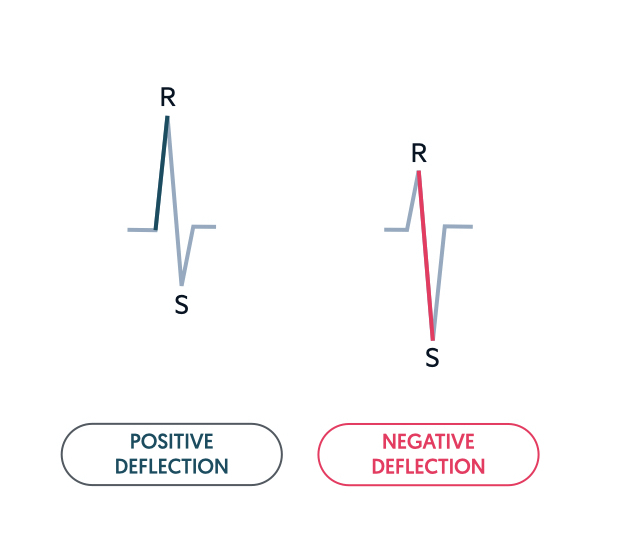
When we say a lead is ‘positive’, we mean the lead has a predominantly upward deflection in the QRS complex. When we say a lead is ‘negative’, we mean the lead has a predominantly negative deflection in the QRS complex.
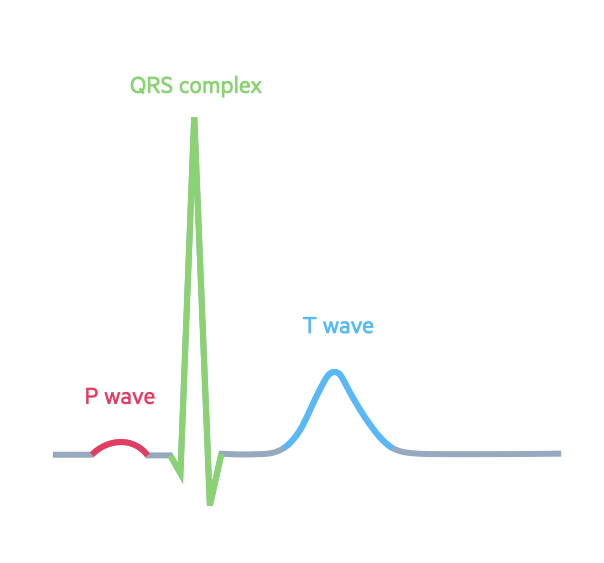
ECG waveforms
The shape of a normal ECG complex includes a P wave, QRS complex and T wave.
The basic ECG strip is made up of a baseline with deflections caused by movement of electrical impulses either toward (positive deflection) or away (negative deflection) from electrodes. The deflections that make up a normal ECG are termed waves and are assigned arbitrary letters.
A normal ECG waveform is composed of:
- P-waves: atrial depolarisation
- QRS complexes (<120 ms): ventricular depolarisation. If first deflection is down it is a Q-wave, if the first deflection is up it is an R-wave.
- T-waves: ventricular repolarisation.
- U-waves: sometimes seen, origin disputed. May be pathological if follows abnormal T-wave
The ECG may be deconstructed into additional key components:
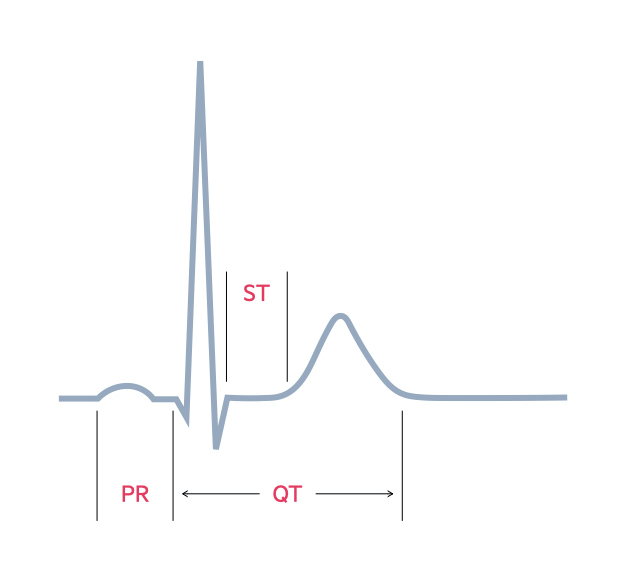
- PR-interval (120-200 ms): time taken for the electrical impulse to travel between the atria and ventricles.
- ST-segment: should be isoelectric (i.e. on the baseline). Can be depressed or elevated (changes typical in ischaemia).
- QT-interval*: varies with heart rate, long QT has many causes but may predispose to polymorphic ventricular tachycardia.
*NOTE: normal QT interval is 350-440 ms in men and 350-460 ms in women
QRS shape
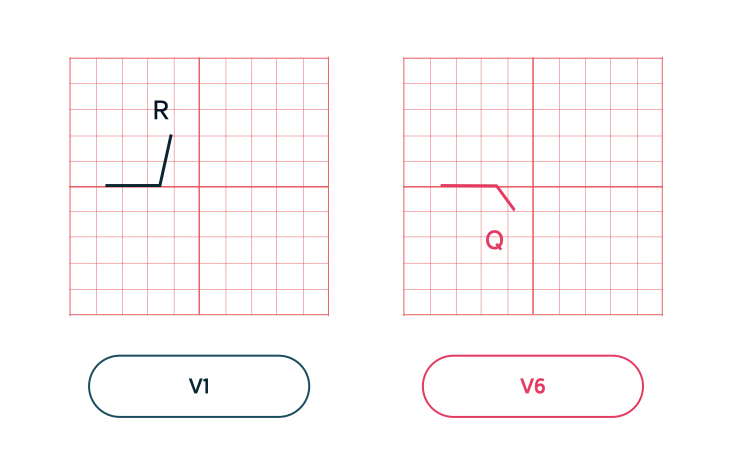
The shape of the QRS complex is due to the imbalance between right and left ventricle and depolarisation of the septum first.
Q waves develop because the septum between the ventricles undergoes depolarisation before the walls. The wave of depolarisation within the septum is from left to right. This means towards the septal leads (V1/V2) and away from the lateral leads (V5/V6).
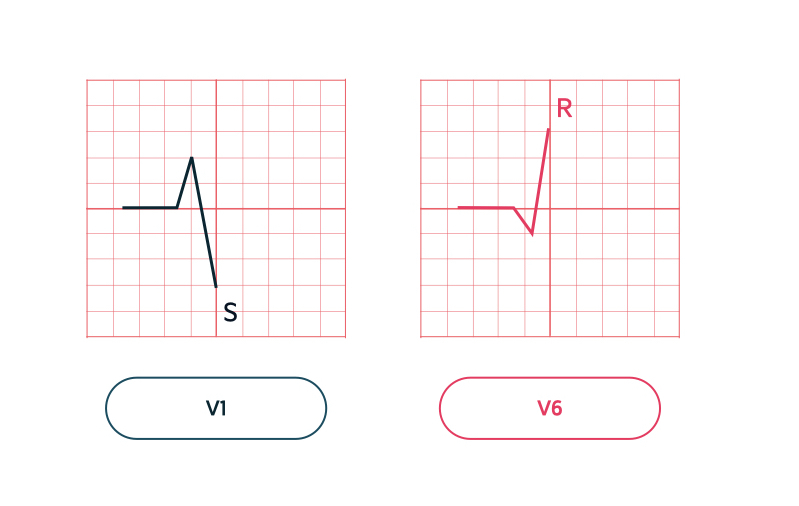
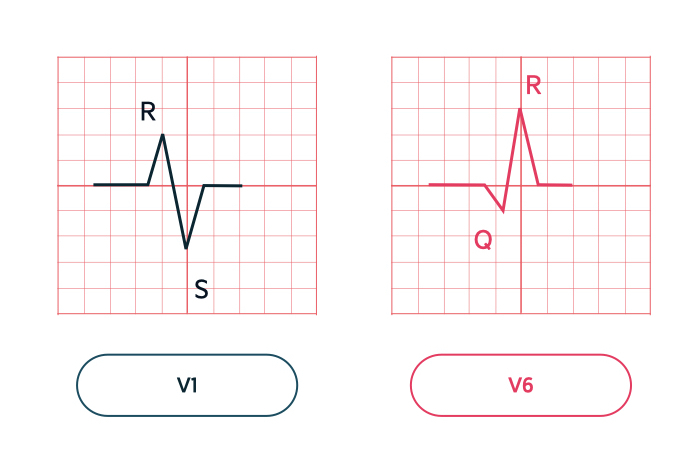
The more muscular left ventricle then exerts more influence on the ECG than the right ventricle leading to a dominant R wave in the lateral chest leads (V5/V6). In the septal leads (V1/V2) we see a small R wave and dominant S wave.
After depolarisation of the whole myocardium, the ECG trace of the QRS complex moves back to the baseline, otherwise known as the isoelectric line.
Last updated: October 2022
Have comments about these notes? Leave us feedback