3. Cardiac axis
Notes
Introduction
The cardiac axis refers to the net effect of all of the generated action potentials.
When looking at the electrical activity of the heart, leads aVR and II look at the heart from opposite directions. The normal wave of depolarisation passes from 11 o’clock (aVR) to 5 o’clock (lead II). This means aVR has a predominantly downward deflection (negative lead) and lead II has a predominantly upward deflection (positive lead).
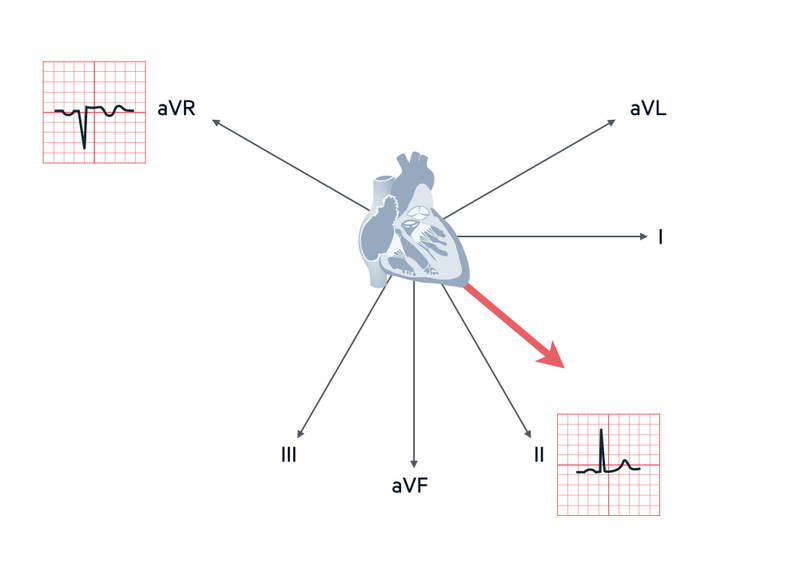
The average spread of depolarisation passing through the ventricles (visualised from the front) is termed the cardiac axis. In different disease states, the axis can be shifted to the left or the right.
Normal axis
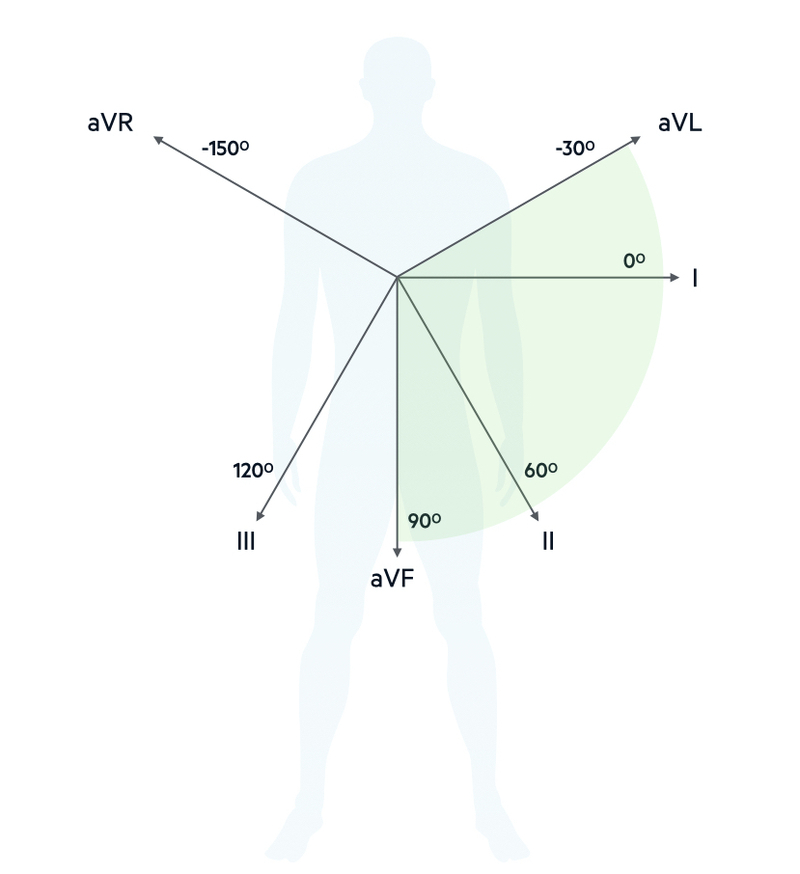
The normal cardiac axis is measured in degrees and runs from -30º to +90º.
A normal axis is said to lie between -30° and 90°. If conduction is delayed in one direction, or one side exerts greater electrical influence, the axis may be deviated to either the left or right. The degrees of the cardiac axis equate to different limb leads. At the extreme of normal left axis is aVL (-30º) and at the extreme of normal right axis is aVF (+90º)
In practice, the measurement of the cardiac axis in degrees is not clinically useful. There is much easier way to determine the axis from leads I, II and III, which is discussed below.
Left axis deviation
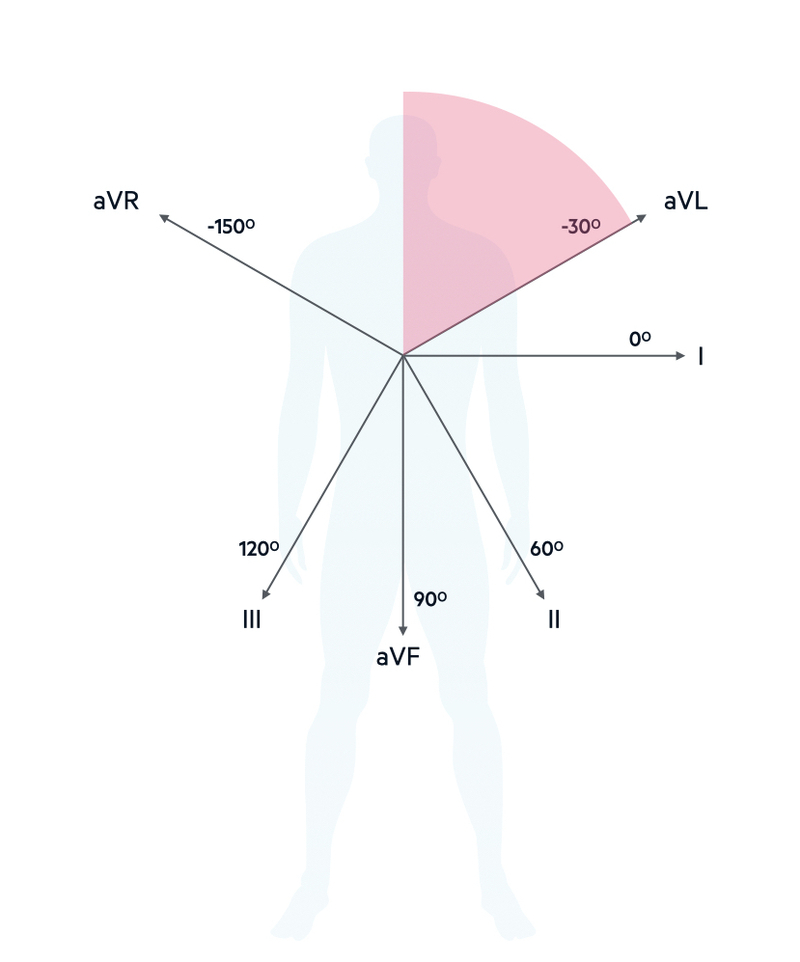
When the average wave of depolarisation is shifted to the left beyond -30º (aVL) it is termed left axis deviation.
Left axis deviation (LAD) leads is commonly seen in clinical practice and usually indicates disease of the left ventricular conducting system (bundle branch, anterior fascicle). By itself, it usually non-specific. However, it may be a feature of more widespread conduction disease or associated with acute cardiac pathology so it is important to consider the clinical context.
Causes of LAD
- Left anterior fascicular block
- Left bundle branch block
- Left ventricular hypertrophy
- Inferior myocardial infarction
Right axis deviation
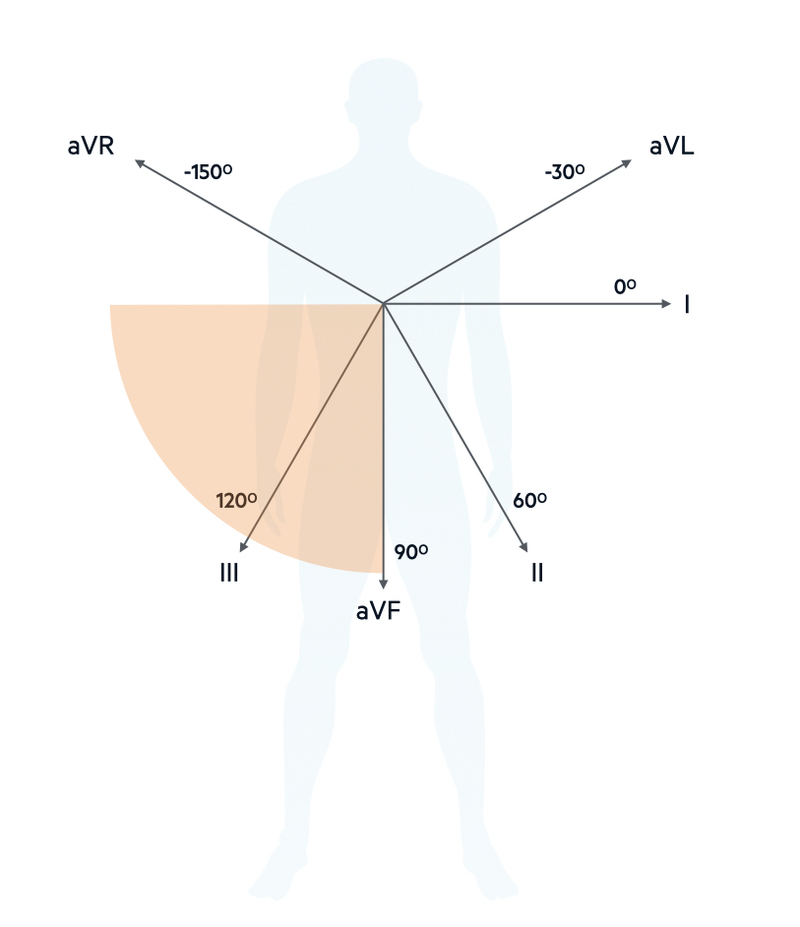
When the average wave of depolarisation is shifted to the right beyond +90º (aVF) it is termed right axis deviation.
Right axis deviation (RAD) is commonly seen in association with pulmonary disease. This is because pulmonary disease can lead to increased pulmonary pressure, which increases the afterload that the right ventricular has to pump against. In doing so, the right ventricle undergoes hypertrophy and thus has more effect on the QRS complex.
Causes of RAD
- Chronic pulmonary disease
- Right ventricular hypertrophy
- Left posterior fascicular block
- Acute pulmonary embolism
- Lateral myocardial infarction
Working out axis
In clinical practice, the direction of the axis is most easily derived from assessment of the limb leads I, II and III.
The cardiac axis can be quickly and easily determined by looking at the net deflection of the limb leads I, II and III. By net deflection, we mean whether a lead is predominantly negative (downward deflection) or predominantly positive (upward deflection).
In the normal axis, lead II shows the greatest upward deflection compared to leads I and III. If the axis is orientated to the left of normal, lead I may have a greater upwards deflection than lead II, but crucially both are still positive.
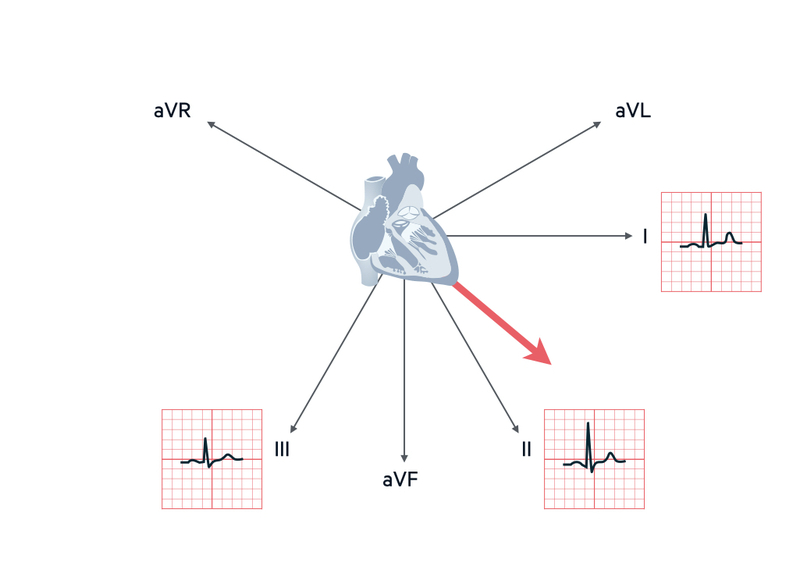
Normal axis
If leads I and II are positive the axis is normal. In this situation, depending on the average wave of depolarisation, lead III may be positive or negative.
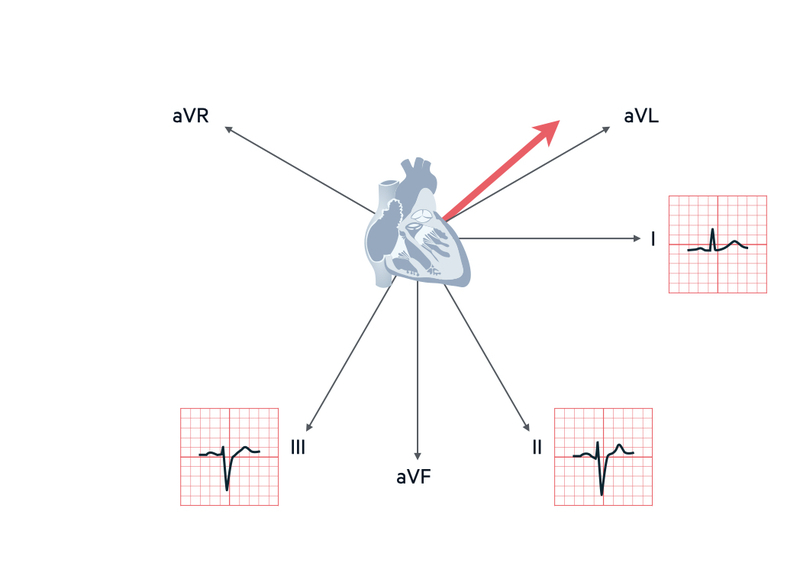
Left axis deviation
If lead I is positive, and lead II and III are negative, it is left axis deviation.
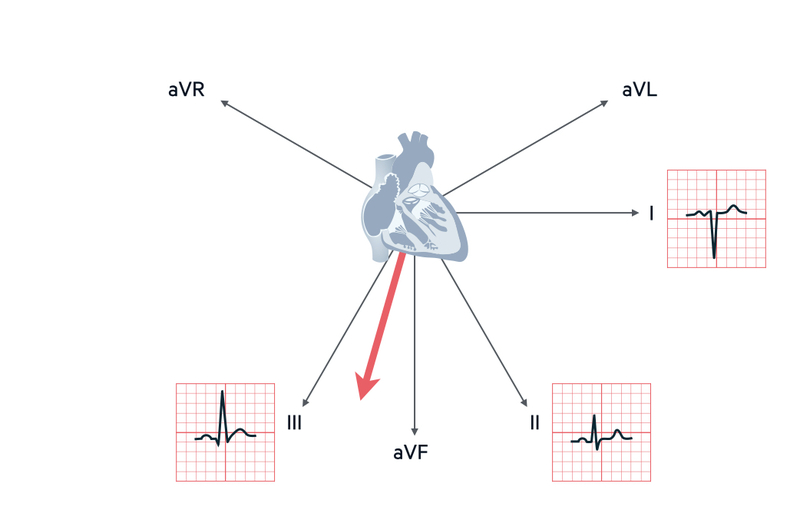
Right axis deviation
If lead III is positive and it has the biggest positive deflection compared to leads I and II, it is right axis deviation
Summary
- Normal: lead I positive, lead II positive, lead III positive/negative
- LAD: lead I positive, lead II negative, lead III negative
- RAD: lead I negative, lead II positive/negative, lead III positive (biggest deflection)
Transition point
The transition point on the ECG is where the R wave is equal to the S wave and marks the interventricular septum.
The QRS complexes in the chest leads (V1-V6) get progressively more positive (predominant upward deflection) as you go from V1 to V6. We can describe this the ‘progression of R waves’. In patients with ischaemic heart disease and damage to the ventricular muscle, we may see a poor progression of R waves. This is due to the smaller amount of viable myocardium undergoing depolarisation.
The transition point describes the lead at which the R wave is equal to the S wave. In other words, the upward deflection of the R wave is the same height as the downward deflection of the S wave.
![]()
The transition point marks the interventricular septum. It is usually around V3/V4. In the presence of right ventricular hypertrophy, this may shift the transition point to V4/V5 or V5/V6. It can be a subtle marker of pulmonary disease.
Last updated: January 2021
Have comments about these notes? Leave us feedback