8. ST segment & T waves
Notes
Introduction
It is important we analyse each aspect of the ECG morphology including P wave, QRS complex, ST segment and T wave.
Abnormalities of the P wave, QRS complex, ST segment and T wave can tell us a lot about the patient. Analysing these parts of the ECG should always be taken in context of the rate, rhythm and clinical status of the patient.
Certain changes to the ECG morphology are classical of an underlying pathology. For example, ST elevation is the characteristic feature of an acute ST-elevation myocardial infarction (STEMI). Other changes are non-specific and can be suggestive of multiple pathologies. For example, T wave inversion may be a normal variant in certain leads, or associated with ischaemia, ventricular hypertrophy or pulmonary embolism (among others).
Here, we discuss problems with the ST segment and T wave.
ST segment abnormalities
The ST segment is typically affected during myocardial ischaemia.
The ST segment is situated between the QRS complex and the T wave. Under normal circumstances, it should remain on the isoelectric line (i.e. be flat).
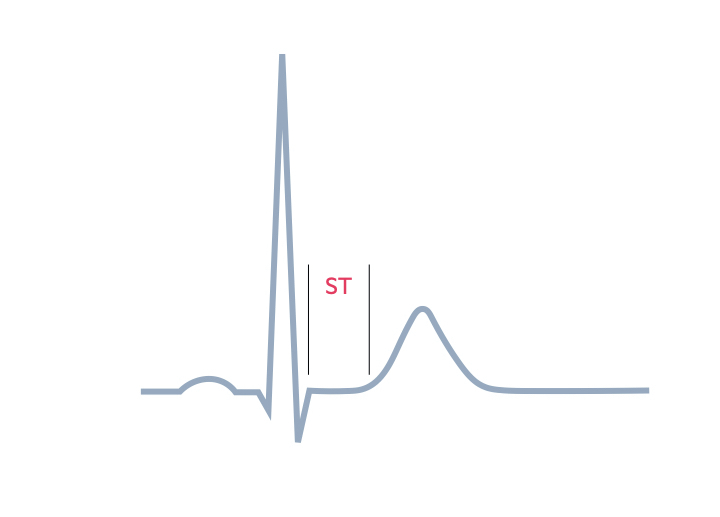
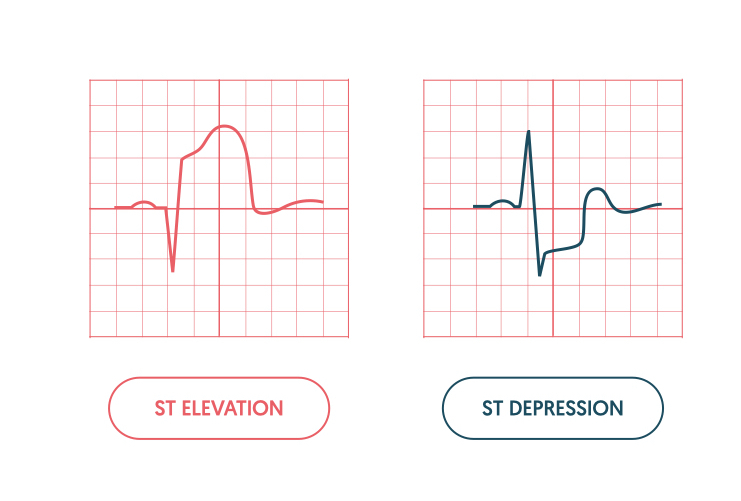
Two predominant abnormalities of the ST segment can occur: elevation and depression
- ST elevation: movement of the segment upwards. May occur due to acute myocardial ischaemia or pericarditis. Other causes can include coronary vasospasm, benign early repolarisation, bundle branch block and ventricular aneurysm.
- ST depression: movement of the segment downwards. May occur due to acute myocardial ischaemia or as a reciprocal change to ST elevation. Other causes can include electrolyte disturbances, digoxin effect and bundle branch blocks.
Acute myocardial ischaemia
ST segment changes are the hallmark of myocardial ischaemia alongside T wave changes (discussed below). This is when there is abnormal blood flow down one or more of the coronary arteries leading to reduced oxygen, tissue ischaemia, characteristic pain and subsequent ECG changes.
ST elevation and ST depression may occur in myocardial ischaemia. ST elevation is suggestive of a STEMI, which is a life-threatening condition that needs urgent coronary intervention. ST depression and T wave inversion are other features of myocardial ischaemia, which in the absence of ST elevation, may represent an non-ST elevation myocardial infarction (NSTEMI) or unstable angina depending on cardiac enzyme results.
ST elevation
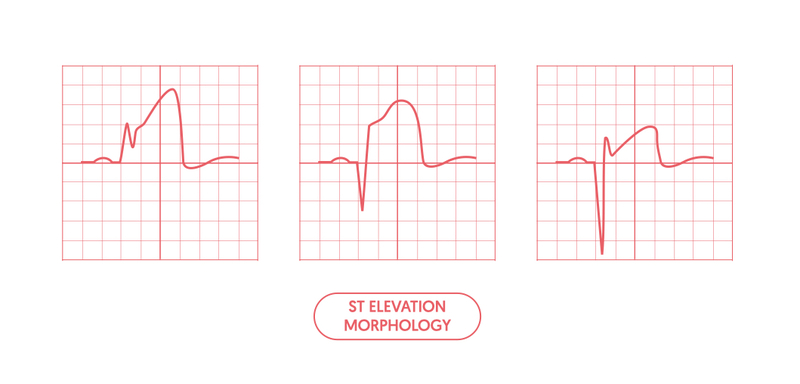
There are different patterns of ST elevation on the ECG, which depend on the underlying cause.
Myocardial ischaemia
An acute STEMI typically presents with ST elevation of varying morphology. The ECG criteria for a STEMI is broadly defined as a ≥2 mm ST segment elevation in 2 contiguous chest leads or ≥1mm ST segment elevation in 2 contiguous limb leads (there may be slightly different variations of these ECG definitions based on age and sex).
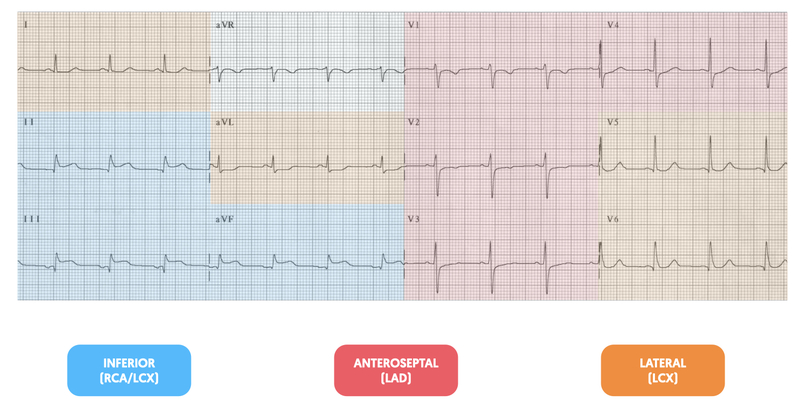
The ST elevation usually occurs alongside Q waves and will occur in the leads that represent a coronary artery vessel territory:
- Anteroseptal STEMI: V1-V4
- Lateral STEMI: V5-V6, I, aVL
- Inferior STEMI: II, III, aVF
- Posterior STEMI: no ST elevation on routine ECG. Dominant R wave V1. May be ST elevation by placing posterior leads V7-V9.
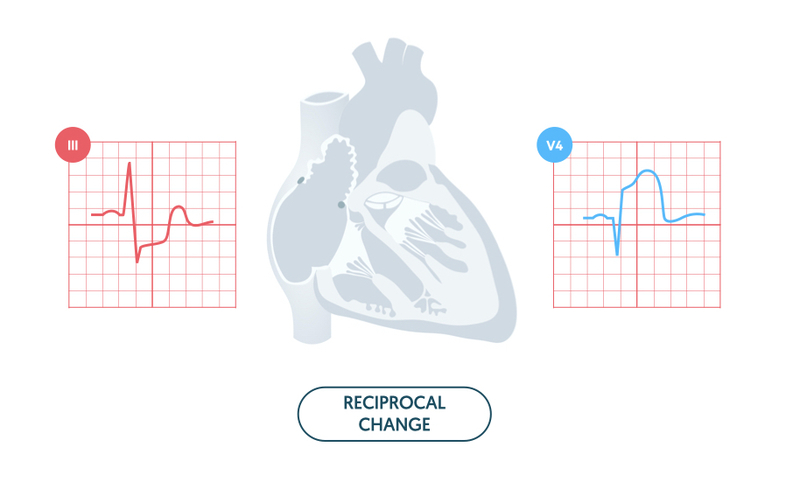
During a STEMI, there are usually reciprocal changes. This refers to ST depression in the leads opposite those with ST elevation. Typical examples:
- Anterolateral STEMI: inferior ST depression (II, III, aVF)
- Lateral STEMI: inferior ST depression (II, III, aVF)
- Inferior STEMI: lateral ST depression (aVL, I)
- Posterior STEMI: anterior ST depression (V1-V3)
Several characteristic ECG changes occur during the natural history of a STEMI.
- Minutes to hours: hyperacute T-waves
- 0-12 hours: ST-elevation
- 1-12 hours: Q-wave development
- Days: T-wave inversion
- Weeks: T-wave normalisation and persistent Q-waves
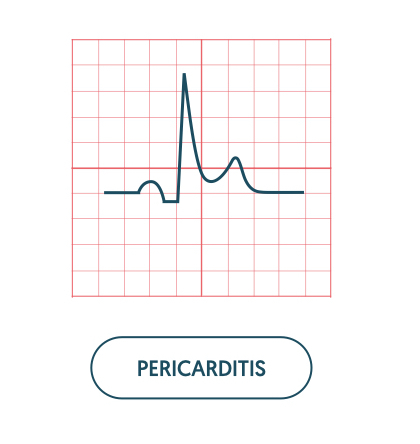
Pericarditis
This refers to inflammation of the lining of the heart known as the pericardium. It leads to classic saddle-shaped ST elevation that is widespread and not related to a coronary artery territory. The other salient feature is PR depression. If reciprocal changes occur, they will be seen in aVR as ST depression and PR elevation.
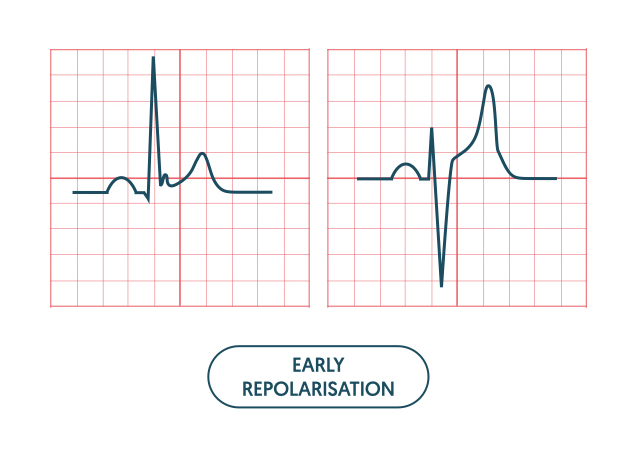
Early repolarisation
This is a benign condition that is seen as mild ST elevation and tall T waves, particularly in young, healthy patients. There may be notching of the J point, which refers to the junction between the end of the QRS complex and start of the ST segment. In clinical practice, early repolarisation is often referred to as ‘high take-off’.
Other
There are various other causes of ST elevation including left bundle branch block, left ventricular hypertrophy, ventricular aneurysm, ventricular paced rhythms and Takotsubo Cardiomyopathy (otherwise known as broken heart syndrome).
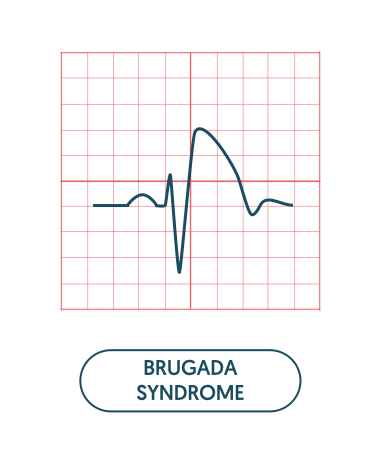
Finally, the inherited channelopathy Brugada syndrome can cause a classic ST elevation with partial right bundle branch block pattern in V1/V2.
ST depression
Myocardial ischaemia is the predominant cause of ST depression.
Myocardial ischaemia
ST depression may occur due to acute subendocardial ischaemia or as a reciprocal change in an acute STEMI. Subendocardial ischaemia essentially refers to non-full thickness infarction and therefore Q waves are not a feature.
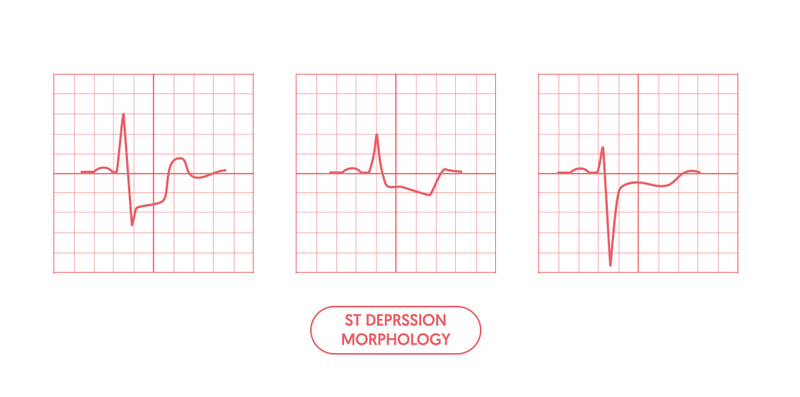
ST depression secondary to subendocardial ischaemia poorly localises to a vessel territory. It may be seen in parts of the anterior, lateral and inferior leads. Evidence of localised ST depression (e.g. inferior leads only) should make you concerned about reciprocal changes in the context of a STEMI.
NOTE: beware of widespread ST depression with evidence of ST elevation in aVR. This is suggestive of left main stem disease or triple vessel disease and needs to be investigated and treated urgently.
Digoxin effect
A characteristic downsloping ST segment is typical with therapeutic doses of digoxin. Other ECG features may include abnormal T waves (flattened, inverted, or biphasic) and a short QT interval (< 350 ms).
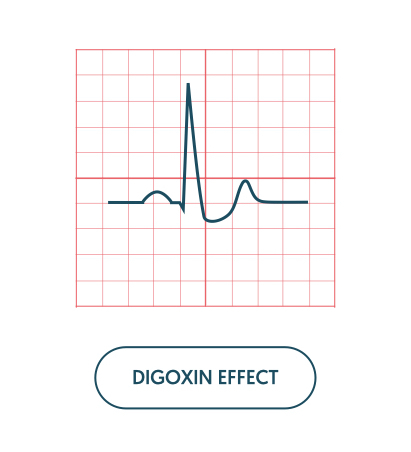
Toxicity is characterised by the development of either tachyarrhythmias (e.g. atrial tachycardia, atrial fibrillation, ventricular tachycardia), extrasystoles or bradyarrhythmias (e.g. slow atrial fibrillation, conduction blocks).
Hypokalaemia
Low potassium is characterised by a down slopping ST segment (widespread) in association with T wave flattening or inversion and U waves. U wave are upright deflections of unknown aetiology occurring after the T wave. For more information see hypokalaemia notes.
T wave abnormalities
T waves are characteristically upright and reflect ventricular repolarisation.
T wave abnormalities may appear on the ECG as flat, inverted, peaked or bifid (initially upright then inverted).
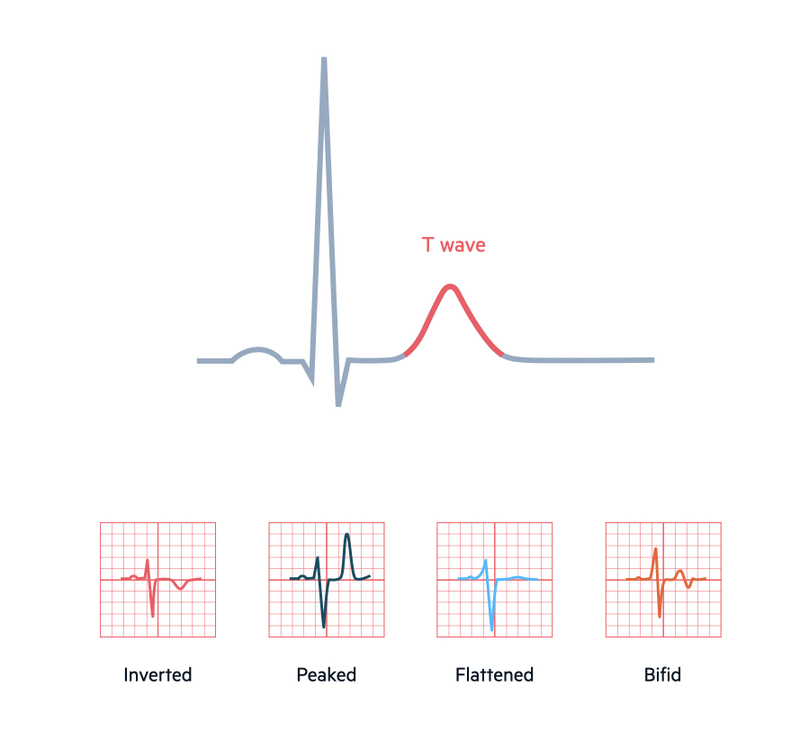
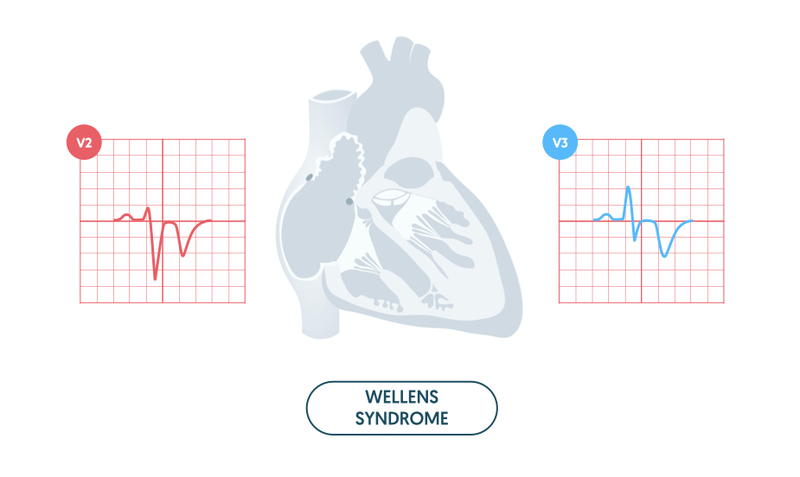
The two predominant changes are T wave inversion and peaked T waves. Flat T waves are generally non-specific and may be linked to ischaemia or electrolyte abnormalities. Bifid T waves are usually seen in ischaemia (e.g. Wellens syndrome - discussed below) or hypokalaemia.
Abnormal T wave appearances may be part of normal variation depending on the ECG leads affected. Pathological causes of T wave changes are associated with myocardial ischaemia, bundle branch block, hypertrophy, electrolyte abnormalities, pulmonary embolism and digoxin treatment.
Normal variants
T waves are usually upright in leads I, II and V2-V6. They are inverted in lead aVR and variable in leads III, aVF, aVL and V1 (i.e. upright or inverted). Normal variation may be seen in some patients with T wave inversion in V2 and V3.
Always consider the clinical state of the patient, age and co-morbidities and previous ECGs when assessing T wave inversion. This should help you decide whether the T wave inversion is a normal variant or pathological. New T wave inversion compared to a previous ECG is always abnormal.
T wave inversion
T wave inversion is a classical feature of myocardial ischaemia.
Myocardial infarction
T wave inversion may be a feature of myocardial ischaemia, even in the absence of ST changes. T wave inversion generally relates to the territory of the coronary artery affected by ischaemia.
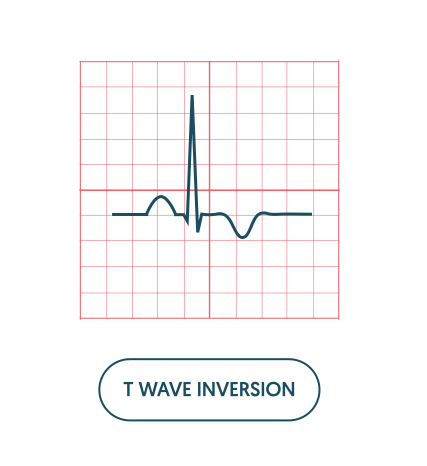
T wave inversion may be fixed, which is usually associated with a previous ischaemic event and associates with Q waves. Alternatively, T wave inversion may be dynamic, which is associated with acute myocardial ischaemia.
Pulmonary embolism
T wave inversion affecting the inferior (II, III, aVF) and right ventricular leads (V1-V3) can be seen in acute pulmonary embolism. It is usually associated with other features of right heart strain. For more information see our notes on P wave, QRS complex and QT interval.
Ventricular hypertrophy
T wave inversion is a feature of both left and right ventricular hypertrophy. For more information see our notes on P wave, QRS complex and QT interval.
Wellens syndrome
Wellens syndrome describes a classic ECG pattern of deeply inverted T waves (or bifid T waves) in the anterior leads V2-V3 (may also be present in V1 and V4). The condition is suggestive of critical stenosis of proximal left anterior descending artery that requires urgent investigation and treatment due to risk of impending myocardial infarction.
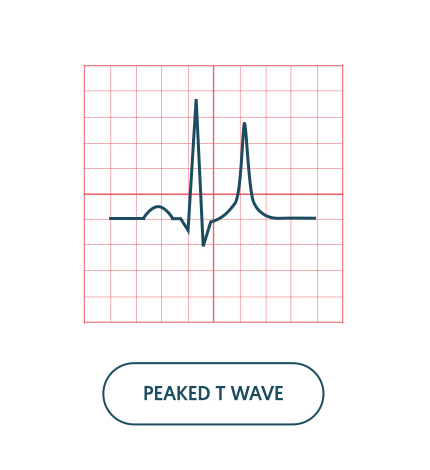
Peaked T waves
Peaked T waves are classical of electrolytes abnormalities or during the early stages of a STEMI.
Peaked T waves refer to an increase in the height of the T wave relative to the QRS complex. They may occur as a narrow, symmetrical peak as in hyperkalaemia, or a broad, asymmetrical peak as in early stages of a STEMI. In the context of a STEMI they are usually referred to as ‘hyperacute’ T waves.
Last updated: January 2021
Have comments about these notes? Leave us feedback