9. Reporting an ECG
Notes
Introduction
It is important to have a good structure for analysing and subsequently reporting an ECG.
When reporting an ECG, you should use the same structured approach every time. This is particularly important when first learning about ECGs. A structured approach allows you to systematically assess the ECG in order and not forget any key elements. Once you improve, you’ll start to develop pattern recognition for classic ECG features.
We propose the following structure for analysing and reporting an ECG:
- Confirm correct patient details
- Rate
- Rhythm
- Cardiac axis
- P waves, Q waves & QRS complexes
- ST segments & T waves
- QT interval
- Putting it all together
This structure uses all the elements we have encountered in our previous ECG notes.
Confirm details
Always confirm the correct details on an ECG before attempting interpretation.
It is essential that the patients name, hospital number and date of birth appear on the ECG. This should be appear alongside the date and time of the ECG.
Details
- Patient Name
- Patient identifiable number (e.g. hospital number)
- Date of birth
- Date
- Time
Often, patients will require serial ECGs to look for any dynamic changes. Therefore, it is essential to be able to tell the order in which ECGs were completed.
Rate
Rate is defined as the number of times the heart beats per minute.
The heart rate is usually automatically printed at the top of the ECG. However, get familiar with calculating the rate yourself. This is particularly important for exams on ECGs (you won’t have the handy metrics at the top!).
Rate
- Division method: 300 divided by the the number of large squares between the R-R interval.
- Multiplication method: number of QRS complexes within 30 large squares multiplied by 10.
Rhythm
Rhythm refers to the part of the heart that is controlling the initiation of electrical activity.
To determine the rhythm of the heart initially look for any P waves.
- Are P waves present?
- Does each P wave correspond with a QRS complex?
If P waves are present and there is a 1:1 relationship with each QRS complex, it is sinus rhythm. If P waves are absent or do not fully correspond with each QRS complex, ask yourself further questions.
- Is the rhythm completely abnormal or just one or two extra beats?
- Is the rhythm regular or irregular?
- Where is the origin of the rhythm? (i.e. ventricular or atrial)
- Does the QRS complex give us a clue to the origin? (i.e. narrow or broad)
- Are the P waves being conducted to the ventricles?
- Is there a block or complete dissociation between atria and ventricles?
All of these questions will help you determine whether there is an ectopic beat, escape rhythm, heart block (and other bradyarrhythmias), supraventricular tachyarrhythmias or ventricular tachyarrhythmia.
Axis
The cardiac axis should be determined by analysis of the limb leads I, II & III.
Cardiac axis can normal, left axis deviated or right axis deviated. To assess this, look at the positive or negative deflections of the QRS complexes in limb leads I, II & III.
- Normal: lead I positive, lead II positive, lead III positive/negative
- Left axis deviation: lead I positive, lead II negative, lead III negative
- Right axis deviation: lead I negative, lead II positive/negative, lead III positive (biggest deflection).
P wave, Q wave & QRS complex
Determine the normal conduction intervals and the morphology of P waves and QRS complexes.
P waves
When assessing P waves, consider:
- Appearance: present or absent
- Morphology: tall P waves in P pumonale or bifid P waves in P mitrale
- PR interval: normal (3-5 small squares), shortened (< 3 small squares) or prolonged (>5 small squares)
Q waves
When assessing Q waves, consider:
- Appearance: present or absent
- Morphology: pathological (> 1 small square in width, > 2 mm in depth and > 25% of the depth of QRS complex)
- Location: usually indicative of myocardial infarction of a particular coronary artery territory
QRS complex
When assessing the QRS complexes, consider:
- Morphology: narrow (< 3 small squares) or broad (>3 small squares)
- Height: criteria for left ventricular hypertrophy or features of right ventricular hypertrophy (dominant R wave V1).
- Pattern: if broad, consider whether right bundle branch block (RBBB) or left bundle branch block (LBBB) pattern
- Origin of tachyarrhythmia: if rate fast, is the QRS narrow (supraventricular) or broad (ventricular). Some exceptions.
ST segments
Assess the ST segments in each of the leads and look for patterns.
The pattern and morphology of ST elevation or ST depression will help you determine the underlying cause.
ST segment
When assessing ST changes, consider:
- Morphology: elevated or depressed
- Location: coronary artery vessel territory, widespread or localised to one or two leads
- Associated changes: Reciprocal changes, T waves changes or Q waves
T waves
T waves may be flat, inverted, bifid or peaked.
When assessing T waves look for any changes in the normal T wave shape and the distribution of the T wave changes. T wave inversion may be a normal variant in some patients. New T wave changes is always pathological. Important to compare with old ECGs (if possible).
T waves
When assessing T waves, consider:
- Morphology: T wave inversion, peaked T waves or bifid T waves
- Location: coronary artery vessel territory, widespread, or localised to one or two leads
- Associated features: any evidence of current or previous myocardial infarction (i.e. ST changes, Q waves)
- Compare old ECGs: any fixed T wave changes suggestive of normal variant (esp. if V1-V2 or lead III) or old infarction
- Evidence of strain: are features of hypertrophy present that may suggest right or left heart strain
QT interval abnormalities
Calculation of the QT interval is required to determine the corrected QT interval.
Calculate the QT interval and then the corrected QT interval (QTc = QT / √RR.).
When assessing the QTc, consider
- Patient gender: male or female
- Length: prolonged (>440 ms in men or >460 ms in women) or shortened (< 350 ms in men and women)
Putting it together
Report a summary of all the major findings with a conclusion as to the working diagnosis.
“This is an ECG of Miss Ellen Pages, hospital number 8972529, date of birth 12/01/1973. The ECG was taken on 06/06/2020. The heart rate is 80 beats per minute and it appears to be in sinus rhythm. The cardiac axis is normal. P waves are present with normal morphology. There are no pathological Q waves and the QRS complexes appear normal and narrow. There are no ST segment changes. There is evidence of T wave inversion in leads aVR, V1-V2 and lead III. The QT interval is 420 ms and the corrected QT interval is 430 ms.”
In conclusion, this ECG shows sinus rhythm with T wave inversion in leads aVR, V1-V2 and III, which are likely normal variants”
Examples
Here are two ECG examples putting our structured approach into practice.
Example one
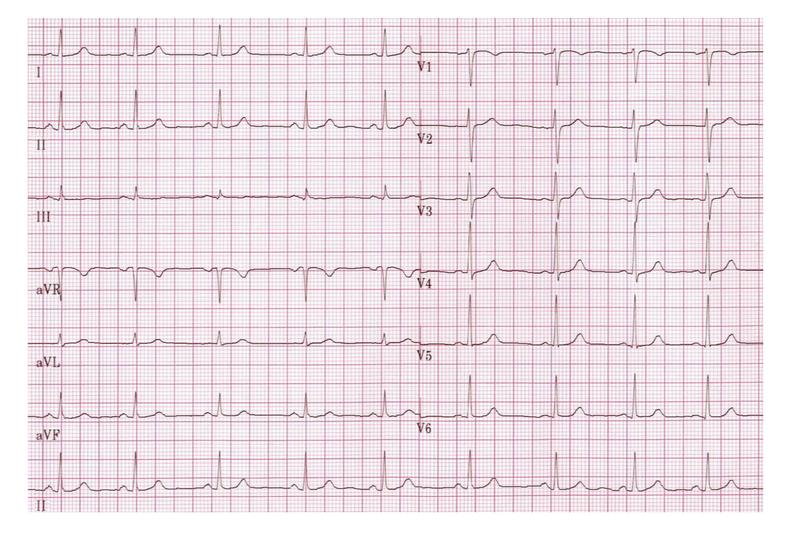
Image courtesy of Wikimedia Commons
- Rate: 65-70 bpm
- Rhythm: sinus rhythm (1:1 ratio between P wave & QRS complexes)
- Axis: normal axis
- P waves: present, normal morphology, PR internal 140-160 ms
- Q waves: no pathological Q waves
- QRS complexes: narrow
- ST segments & T waves: no ST changes, T wave inversion aVR/V1 (normal variants)
- QT interval: ~360 ms (corrected ~375 ms)
- Conclusion: Normal sinus rhythm
Example two
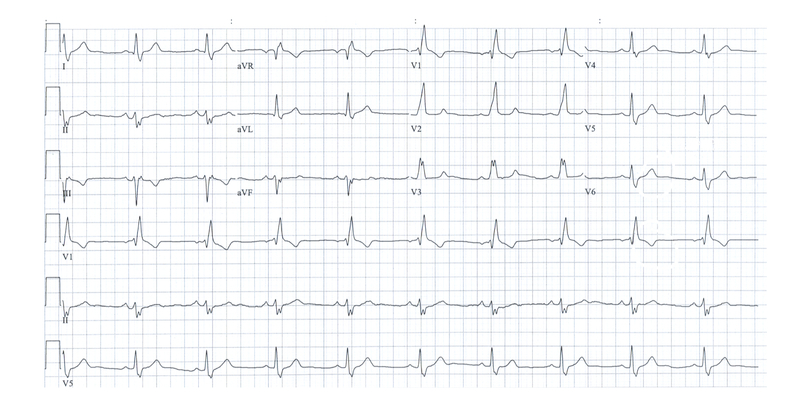
Image courtesy of Wikimedia Commons
- Rate: 60 bpm
- Rhythm: sinus rhythm (1:1 ration between wave & QRS complexes)
- Axis: left axis deviation (Lead I positive deflection, leads II & III negative deflection)
- P waves: present, normal morphology, PR internal ~160 ms
- Q waves: no pathological Q waves
- QRS complexes: broad complexes (> 120 ms), right bundle branch block morphology (positive deflection V1)
- ST segments & T waves: ST segments appear normal, T wave inversion aVR, V1 & III in context of RBBB
- QT interval: QT 400 ms (corrected ~400 ms)
- Conclusion: sinus rhythm with left axis deviation and right bundle branch block (i.e. Bifascicular block).
NOTE: left axis deviation indicates left anterior hemiblock due to a block in the anterior fascicle of the left bundle branch
Last updated: January 2021
Have comments about these notes? Leave us feedback