Sampling
Notes
Rationale for sampling
A population is a complete group of individuals such as all the residents of a country.
Involving the whole population is unrealistic in terms of cost and staff time. Sampling is preferable and often the only way forward. Individuals who are reasonably easy to contact are selected making the study viable. Remember that due to random fluctuation information gained from different samples will not be identical even with the same method of selection. Also, some of the individuals selected will not be willing and/ or able to be involved leading to non-response bias.
Random sampling
A sampling frame (complete list of the members of the population) is needed for random sampling.
Selection at random implies that all population members have a known chance of being chosen, none is certain to be included and none can be excluded. All three criteria need to be satisfied for a sampling method to be accurately described as random.
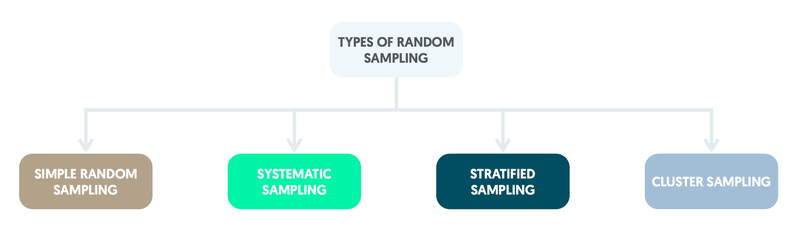
Simple random sampling
Simple random sampling requires a numbered list of the individuals in the population. Numbers are selected at random from those that appear on the list and the corresponding individuals are used to form the sample.
Systematic sampling
Systematic sampling involves taking individuals from a list at regular intervals by dividing the sampling frame into sections of equal size. It is a form of random sampling as the initial individual is selected at random from the first section. The patients thereafter are taken from the corresponding point within the subsequent sections.
Stratified random sampling
Stratified random sampling is conducted by dividing the population into groups (strata). A simple random sample is then taken from each stratum. This method is generally applied if one of the groups of interest within the population is relatively small. Stratified random sampling can be used to ensure that equal numbers are chosen from each group. It is possible for simple random sampling to exclude groups in the population that are very small.
Cluster sampling
Cluster sampling is useful if it is easier to select groups of individuals (clusters) than specific individuals. It may be more practical, for instance, to involve families by sampling from a list of addresses and recruiting all of the family members as a cluster.
Multistage sampling
Multistage sampling is useful if the population consists of groups that are geographically dispersed. For instance, in a study of hospital wards in the UK it would be more practical to sample from a list of UK hospitals and then take a random sample of wards from the chosen hospitals.
Other methods of sampling
If a sampling frame is not available for the population, other methods of selection that involve the judgement of the researchers are available. However, deductions made regarding the population are likely to be biased.
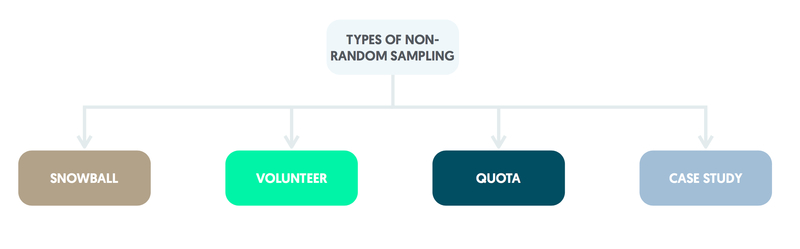
Snowball sampling
Snowball sampling commences with an initial group of participants identified by the researchers. Each group member then uses their own social network to recruit further participants. This type of sampling is useful in recruiting participants from hard-to-reach groups such as the homeless.
Volunteer sampling
Volunteer sampling recruits participants from individuals interested in being involved. It tends to attract people who might have strong views, e.g. about the NHS, not representative of the overall population.
Case report & case series
Individuals selected for case reports and case series participants are unlikely to reflect typical patients attending the clinic in which the study is conducted. This is because clinical judgement is used in the identification of patients likely to be of interest for the research team.
Quota sample
A quota sample is obtained by recruiting a particular number of individuals from those immediately to hand.
It is possible to take into account any known characteristics of the overall population of interest, e.g. age or gender distributions. Quota samples have a reputation for being highly unrepresentative and are best avoided in research proposals.
Checking a sample against a population
Once a sample has been drawn it is sometimes possible to perform checks as to whether it is representative of the population, e.g. on average age.
Similarity on a particular variable does not imply that the sample is completely representative of the population; the sample may differ on variables for which population information is unavailable.
Cycle of research
Information relevant to a particular research question is built up through the cycle of research.
This can be summarised as Population > Design > Sample > Deduction > Population, etc.
Starting from the population of interest, an appropriate study is designed. Based on the chosen design, a sample is selected from the population. Methods of analysis are then applied to the data collected and the results obtained enable deductions to be made about the original population. This cycle is then repeated in subsequent studies.
Accuracy of a sample mean
The sample mean can be a useful way of summarising the average for a quantitative variable.
Assuming that the observations are representative of the population, increasing the sample size by recruiting further participants enables the estimated mean to become closer to the true mean for the population.
Also, if the population standard deviation is small, it will be easier to obtain an accurate estimate of the true mean. Hence a sample of 2000 observations will produce a more accurate estimate of the mean than one of 200, and for a particular sample size the estimate of the population mean will be more accurate if the standard deviation is 5 rather than 10.
Standard errors
A measure of the expected error in a sample estimate, such as an average, is the standard error.
For the mean of a sample, this is calculated as the standard deviation (σ) divided by the square root (√) of the sample size (x). The standard error can be used to provide information about the accuracy of an estimate calculated from a sample.
If samples are repeatedly taken from a population, the true mean can be expected to lie between the sample mean minus 1.96 standard errors and the sample mean plus 1.96 standard errors for 95% of the samples generated, hence the 95% confidence interval for a mean.
For the above method a few simple assumptions need to be met. The sample must be chosen at random from the population as non-random methods of selection almost always lead to biased estimates. Observations must be independent of each other in the sense that the value of the measure for one individual should not affect the value of the measure for any of the other members of the sample. Finally, the sample size should not be small; observations from at least 60 individuals should to be available.
Binary variable & standard error
For a binary variable, the standard error for a proportion is obtained as follows:
- Multiply the proportion with the characteristic by the proportion without the characteristic.
- Divide this number by the sample size.
- Take the square root.
If samples are repeatedly taken from a population, the true proportion can be expected to lie between the sample proportion minus 1.96 standard errors and the sample proportion plus 1.96 standard errors for 95% of the samples generated, hence the 95% confidence interval for a proportion.
95% confidence intervals
In order for this method of obtaining a 95% confidence interval to be valid, a few simple assumptions need to be met. Apart from random sampling and independent observations, the sample size should not be small. Also, the proportion with the characteristic should not be close to either 0 or 1 otherwise the 95% confidence interval might have nonsensical limits.
Calculation of 95% confidence intervals for sample means and proportions relies on the Central Limit Theorem.
For large samples, the sample means have an approximately Normal distribution, even when the individual data have a non-Normal distribution and the standard deviation of these sample means is given by the standard error.
The corresponding form of the Central Limit Theorem for the standard error of a proportion is that for large samples, the proportions obtained have an approximately Normal distribution, and the standard error can be calculated from the sample size and the proportion having the characteristic of interest.
Last updated: September 2017
Have comments about these notes? Leave us feedback