Lung function tests
Notes
Introduction
Lung function tests aid the diagnosis of numerous respiratory conditions.
Ventilation is the process by which air (or other gases) is moved in and out of the lungs to facilitate gas exchange. Lung function tests allow us to measure the volume and flow of inhaled gases. An understanding of these tests and what they show, both in health and disease, aids clinicians in the diagnosis of respiratory (and related) disease.
Volumes
The volume of air during inspiration and expiration, at different levels of exertion, can be categorised into lung volumes. These volumes are highly dependent on height, weight, gender, age and ethnicity, we will give average values for healthy young people.
- Tidal Volume (VT): the amount we inspire and expire around during normal breathing (approx 500ml for men and women). Minute volume, the amount we respire in a minute is calculated by multiplying VT by the respiratory rate.
- Inspiratory reserve volume (IRV): the additional volume inspired with maximal effort (approx. 2L for women, 3.1L for men).
- Expiratory reserve volume (ERV): the additional volume expired with maximal effort (approx. 0.7L for women, 1.2L for men).
- Residual volume (RV): the volume that remains after maximal expiration (approx. 1.1L in women, 1.2L for men).
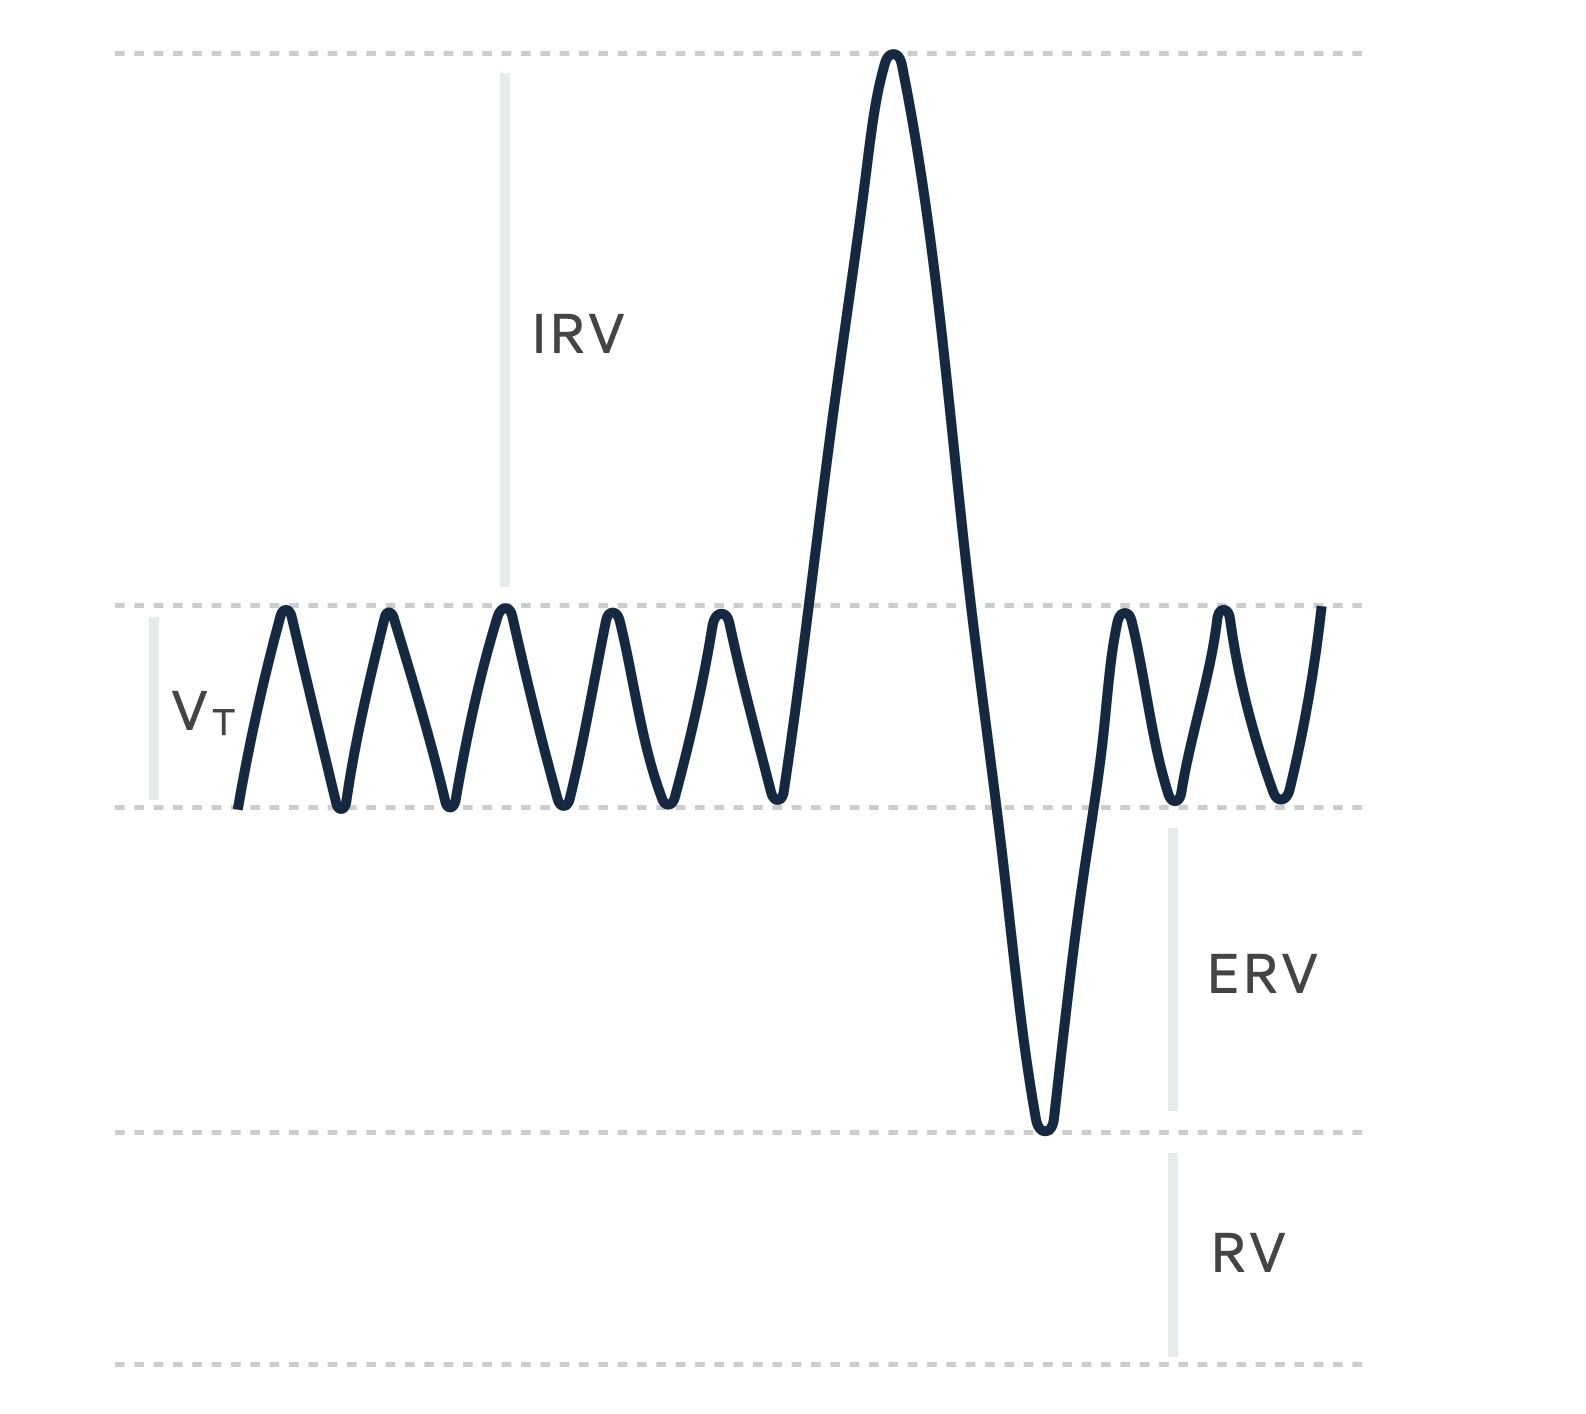
The above graph can be a little difficult to interpret at first glance. It shows the result of monitoring volume changes during breathing. As the patient inspires the graph goes up and as they expire it goes down. The tidal volume (VT) is seen as the central wave and represents normal gentle breathing. The sharp upward deflection represents the patient inspiring with maximal effort, filling the lungs, the sharp downward deflection represents maximal expiration leaving only the residual volume in the lungs.
Capacities
Lung volumes may be combined to give capacities:
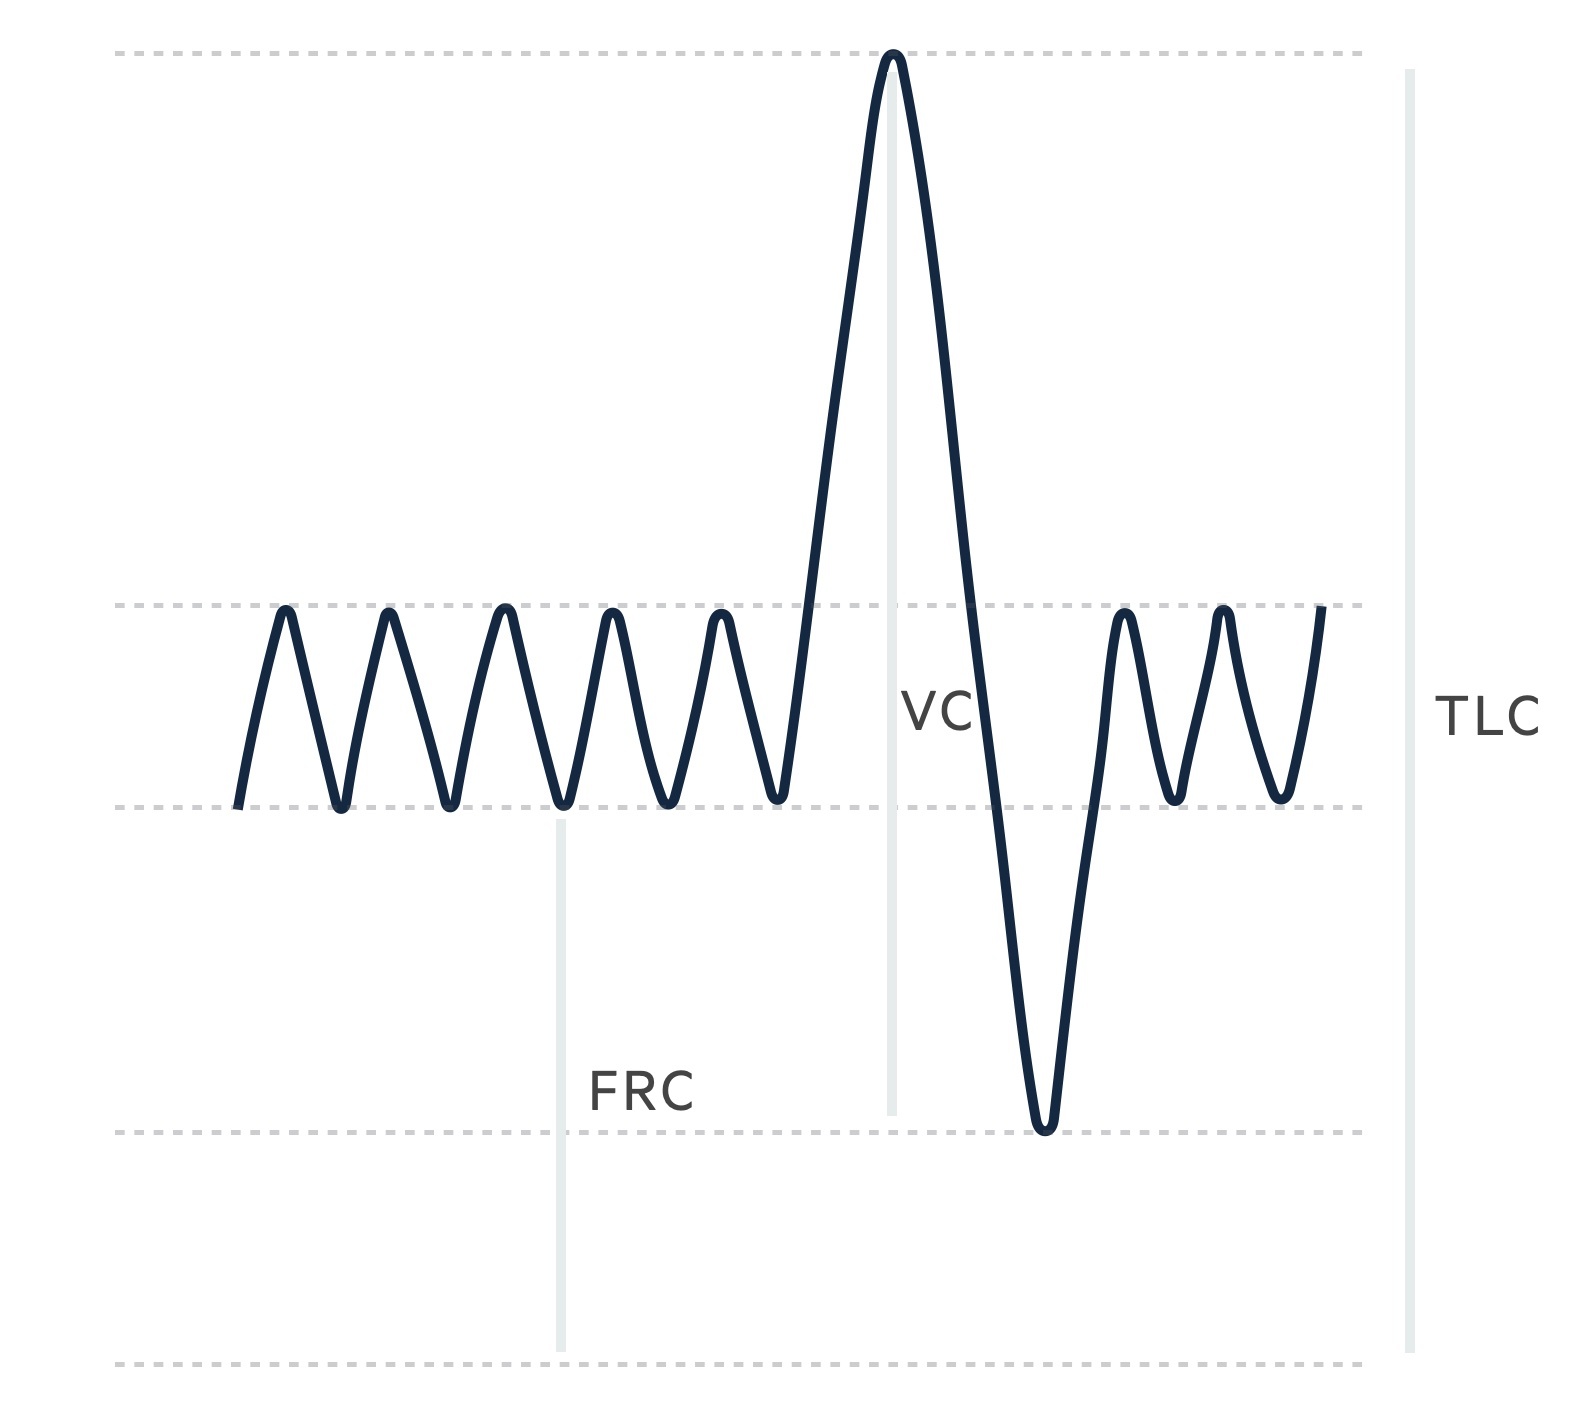
- Functional residual capacity (FRC): this is a combination of the ERV and RV (approx 1.8L for women, 2.4L for men).
- Vital capacity (VC): volume of gas on maximal inspiration and expiration, a combination of IRV, TV and ERV (approx 3.2L for women, 4.8L for men).
- Total lung capacity (TLC): the total volume of gas in lungs at maximal inspiration, a combination of IRV, TV, ERV and RV (approx 4.3L for women, 6L for men.
Peak flow
A peak flow is a simple test of the peak flow rate during forced expiration following maximal inspiration.
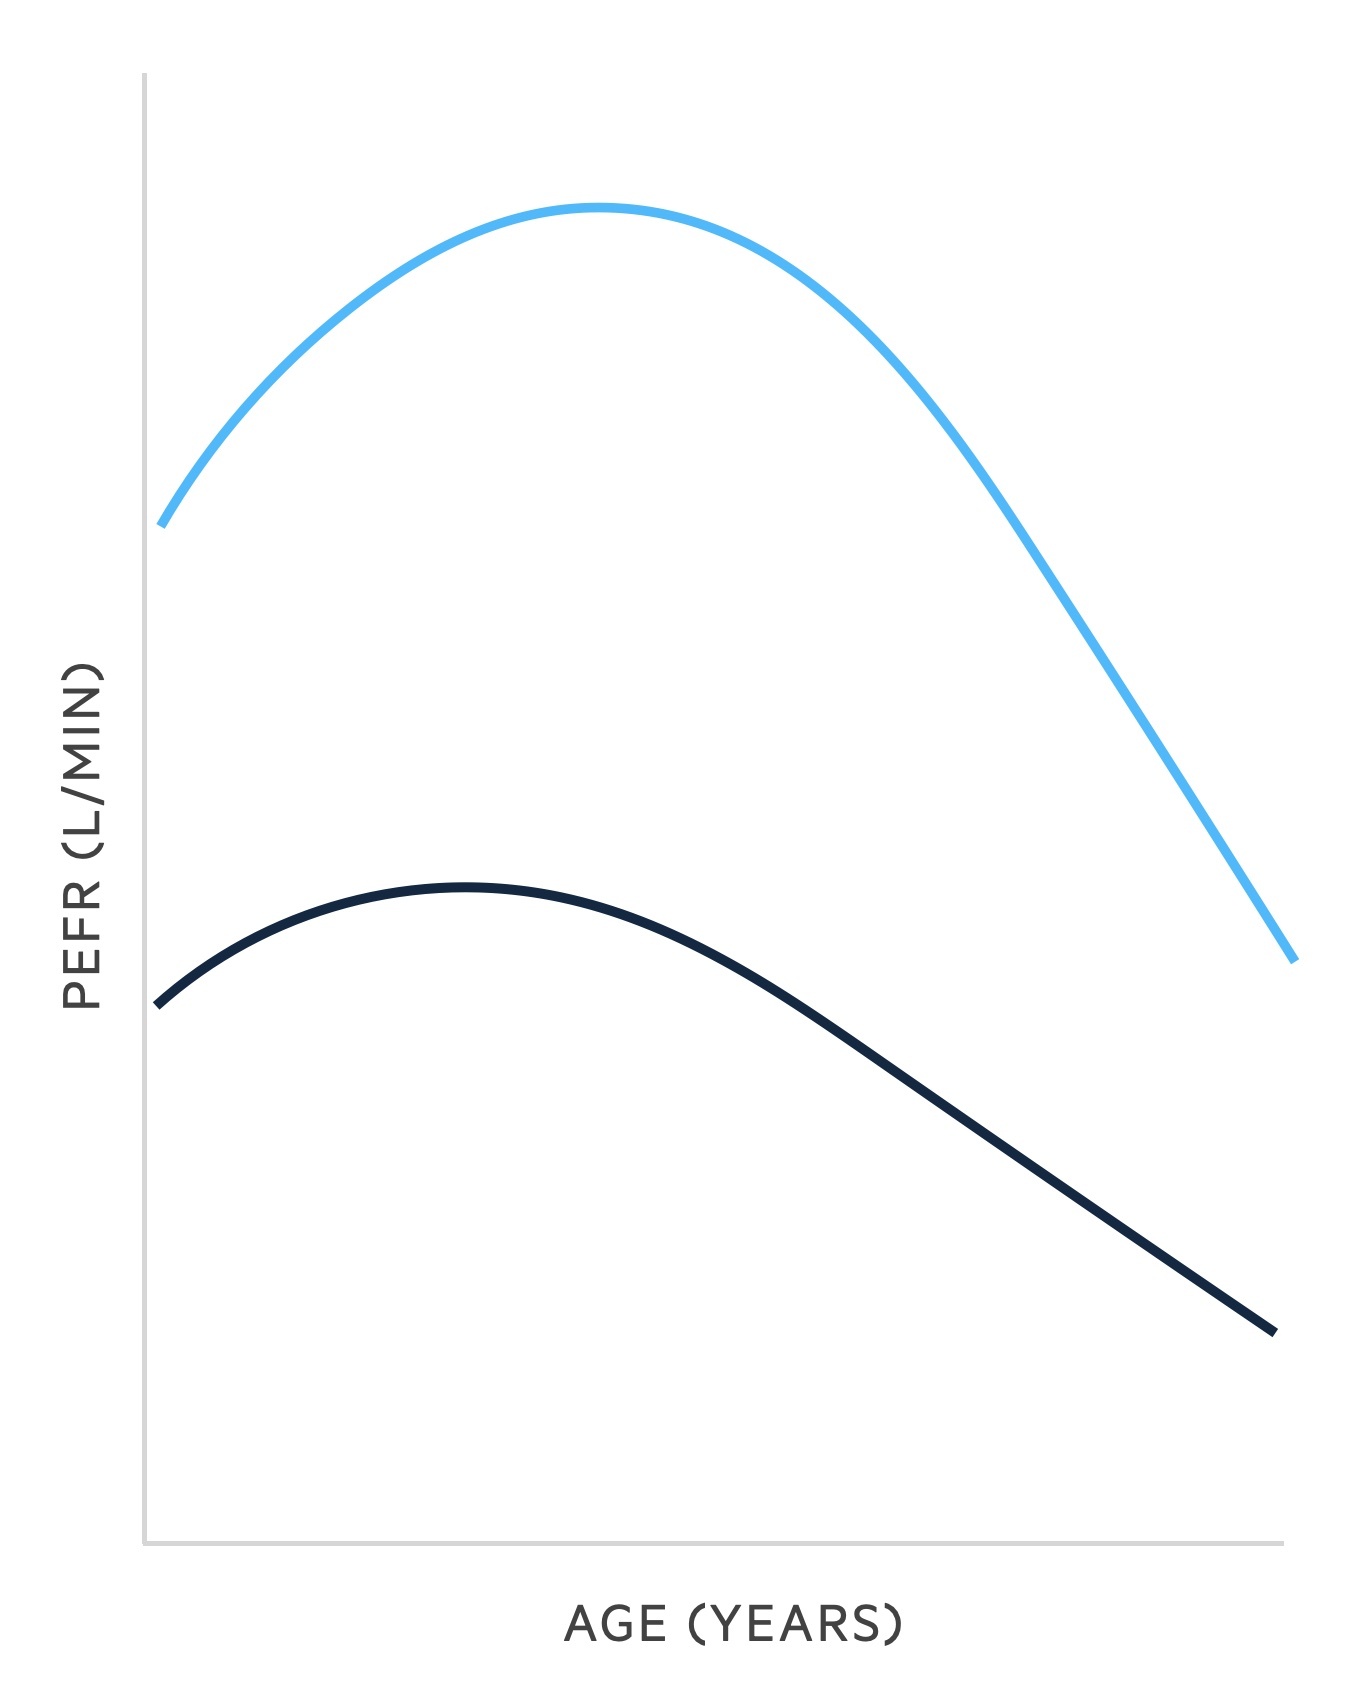
Patients are instructed to expire, as hard and fast as they can, into the device. They are normally given three attempts with the best value recorded. Results must be corrected to normal values for a patient's age and gender. Normal values peak in the third decade for men and women (slightly earlier peak in women) before falling as we age.
Peak flow demonstrates diurnal variation. Flow tends to be highest in the afternoon and lowest in the early hours. It is, on average, higher in men (light blue) than women (dark blue). Peak flow also varies significantly with height. A healthy young man may expect a peak flow of 600-660 L/min, while a woman may expect a value of 420-460 L/min.
The diagnostic value of peak flow is limited due to a wide range of normal values. Results may only drop after significant disease has developed.
However, it may be used to:
- Monitor disease over a period of days or months through a peak flow diary.
- Stratify the severity of an asthma attack.
Spirometry
Spirometry measures the volume of air on forceful expiration following maximal inspiration.
Spirometry is a relatively straightforward procedure that can be completed quickly. It involves the patient taking in a deep breath to fill the lungs (maximal inspiration), followed forceful expiration - attempting to expire the air as quickly and for as long as possible into the mouthpiece of a spirometer.
During spirometry, the following is measured:
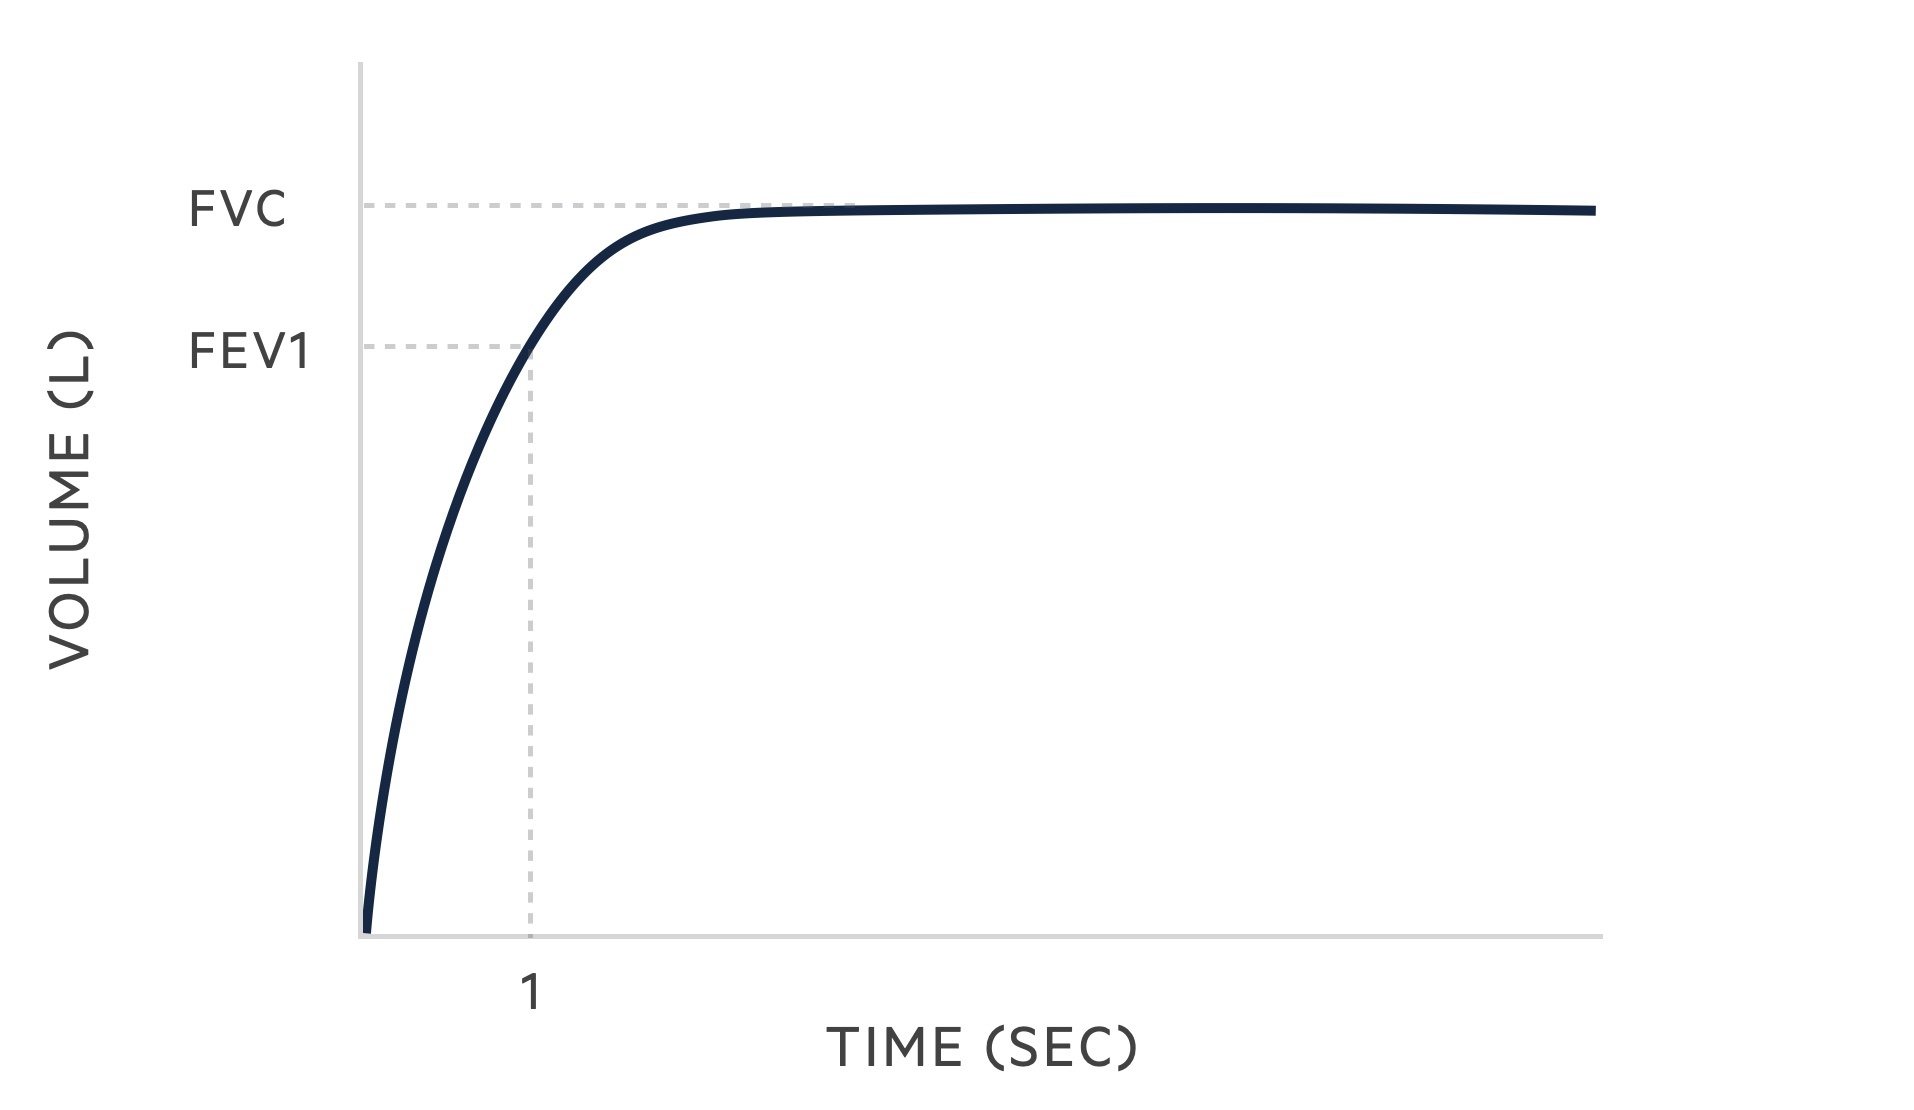
- FVC: the forced (expiratory) vital capacity, a person's maximal expiration following full inspiration.
- FEV1: the forced expiratory volume in one second, i.e the volume of FVC expelled after one second.
- FEV1/FVC: derived from the two measurements above, may be given as a ratio or percentage. It is the proportion of the FVC that is expelled in the first second of forceful expiration.
Normal values for FVC and FEV1 depend on gender at birth, height, weight, age and ethnicity. Reference values are used to determine normal results based on these factors. Different countries and populations may use different reference values. A healthy adult male may have an FVC of 5-5.5L whilst a healthy adult female may have an FVC of 3.5-4L.
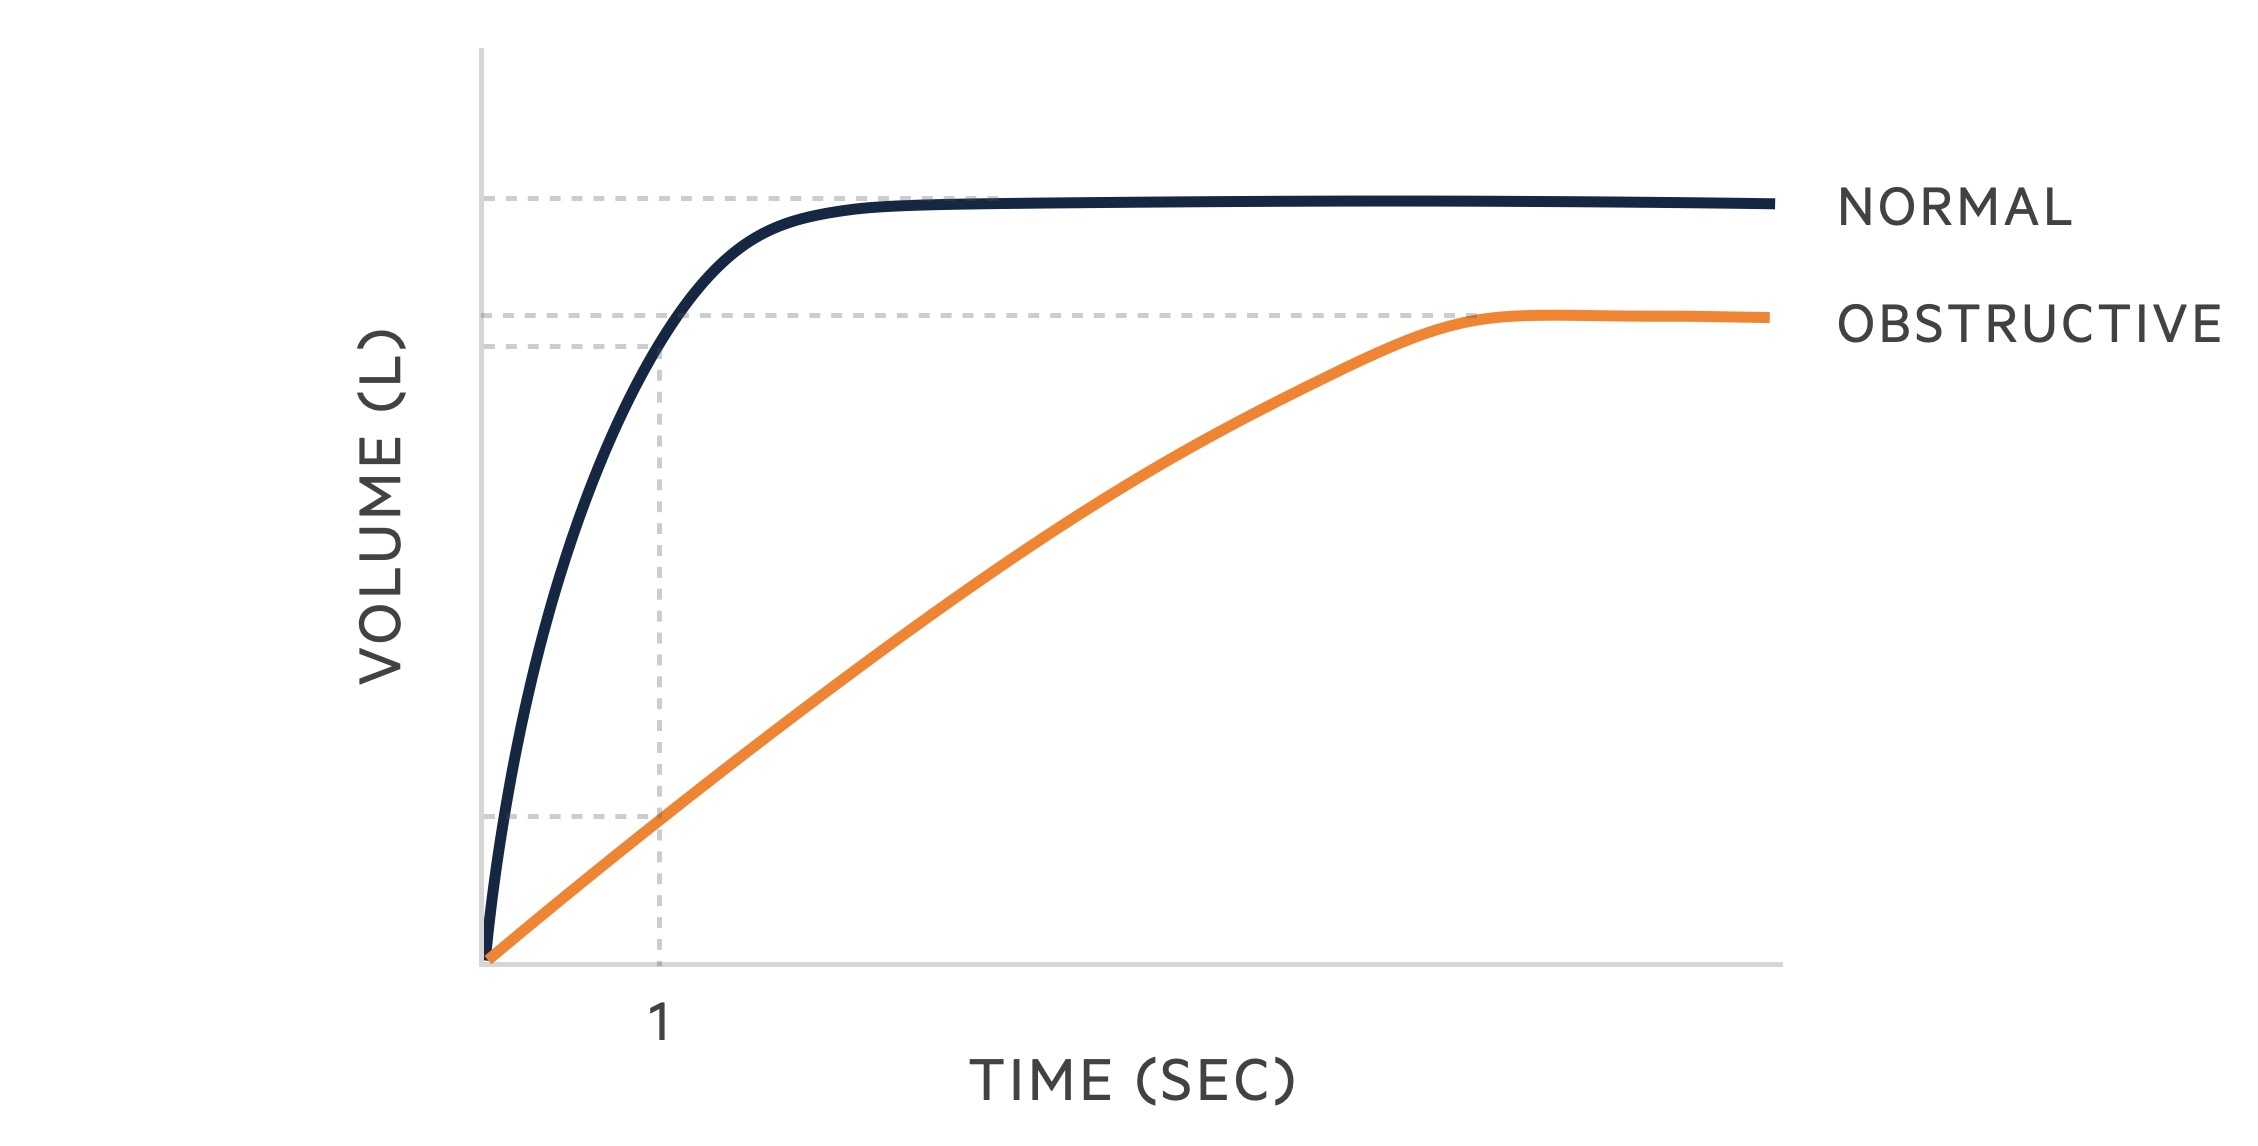
Spirometry is an extremely useful and commonly completed test, it helps us distinguish between obstructive and restrictive lung diseases.
Obstructive
In obstructive lung disease, there is an increase in airway resistance and a decrease in the expiratory flow. Increased resistance may be secondary to airway inflammation and secretions, bronchospasm and/or reduced elastic recoil.
As such obstructive lung diseases are characterised by a greater reduction in the FEV1 than in the FVC, as such the FEV1/FVC ratio is < 70%.
Obstructive lung disease includes (ABC):
- Asthma
- Bronchiectasis
- COPD (chronic bronchitis and emphysema)
- Others (cystic fibrosis, bronchiolitis)
The following changes are seen in obstructive lung disease:
- FVC: may be normal but often reduced due to air trapping
- FEV1: reduced
- FEV1/FVC: < 70%
In patients with an obstructive picture on spirometry, reversibility testing may be used. Reversibility testing involves the adminstration of bronchodilator therapy and then repeating spirometry. Significant reveribility increases the chances of asthma being the correct diagnosis, though this can also be seen in COPD at times.
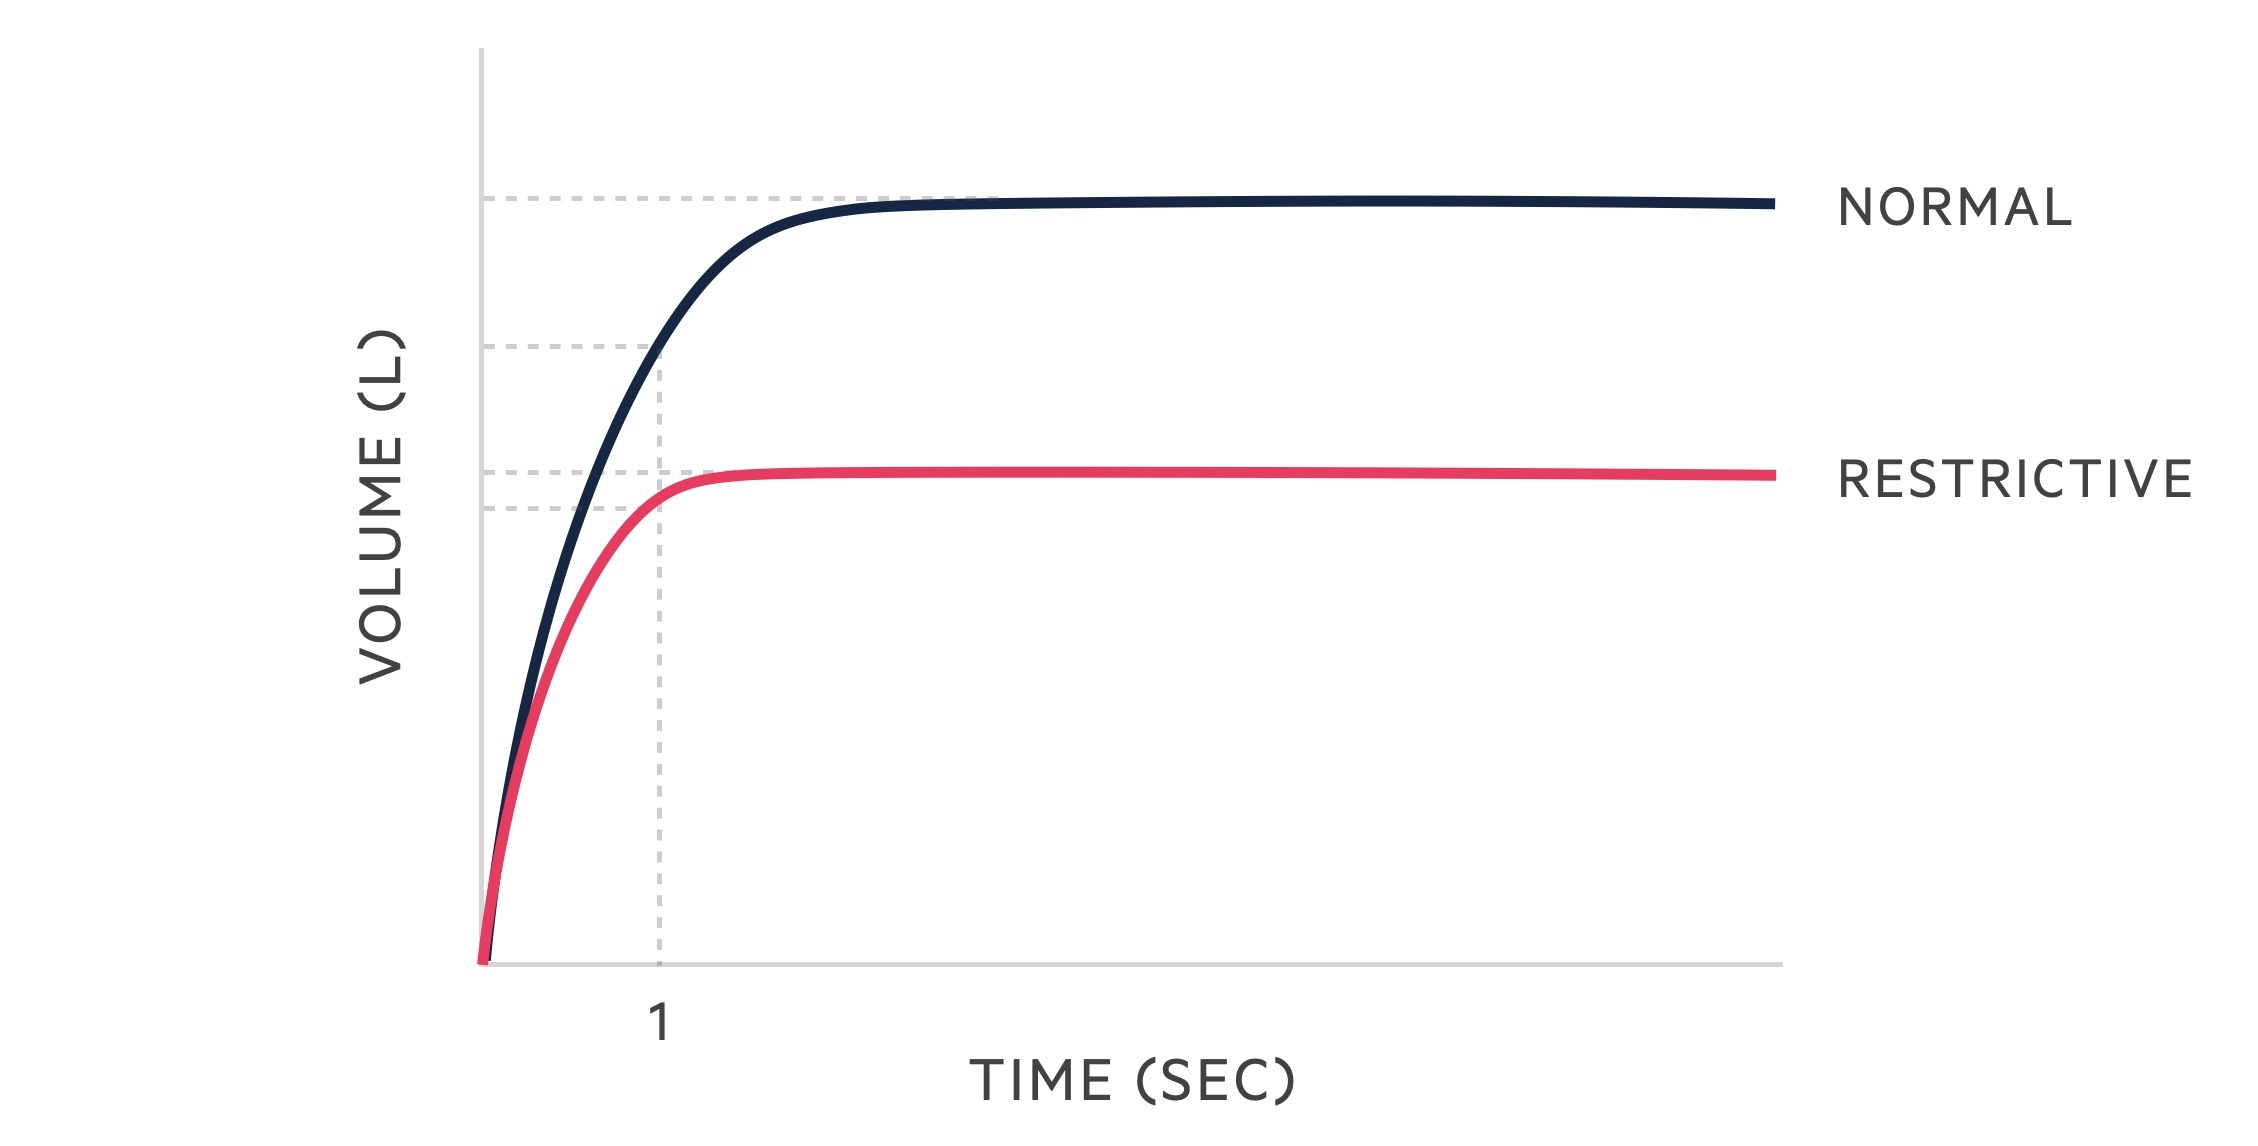
Restrictive
Restrictive lung diseases are characterised by a reduced TLC. Spirometry tends to reveal a reduced FVC with a relatively preserved FEV1. There are many causes of restrictive lung (PAINT):
Intrinsic:
- Pleural (e.g. pleural effusions, chronic empyema)
- Alveolar (e.g. oedema, haemorrhage)
- Interstitial (e.g. idiopathic pulmonary fibrosis, sarcoidosis)
Extrinsic:
- Neuromuscular (e.g. myasthenia gravis, ALS)
- Thoracic/extrathoracic (e.g. kyphoscoliosis, obesity, ascites)
The following changes are seen in restrictive lung disease:
- FVC: reduced
- FEV1: reduced
- FEV1/FVC: > 70%
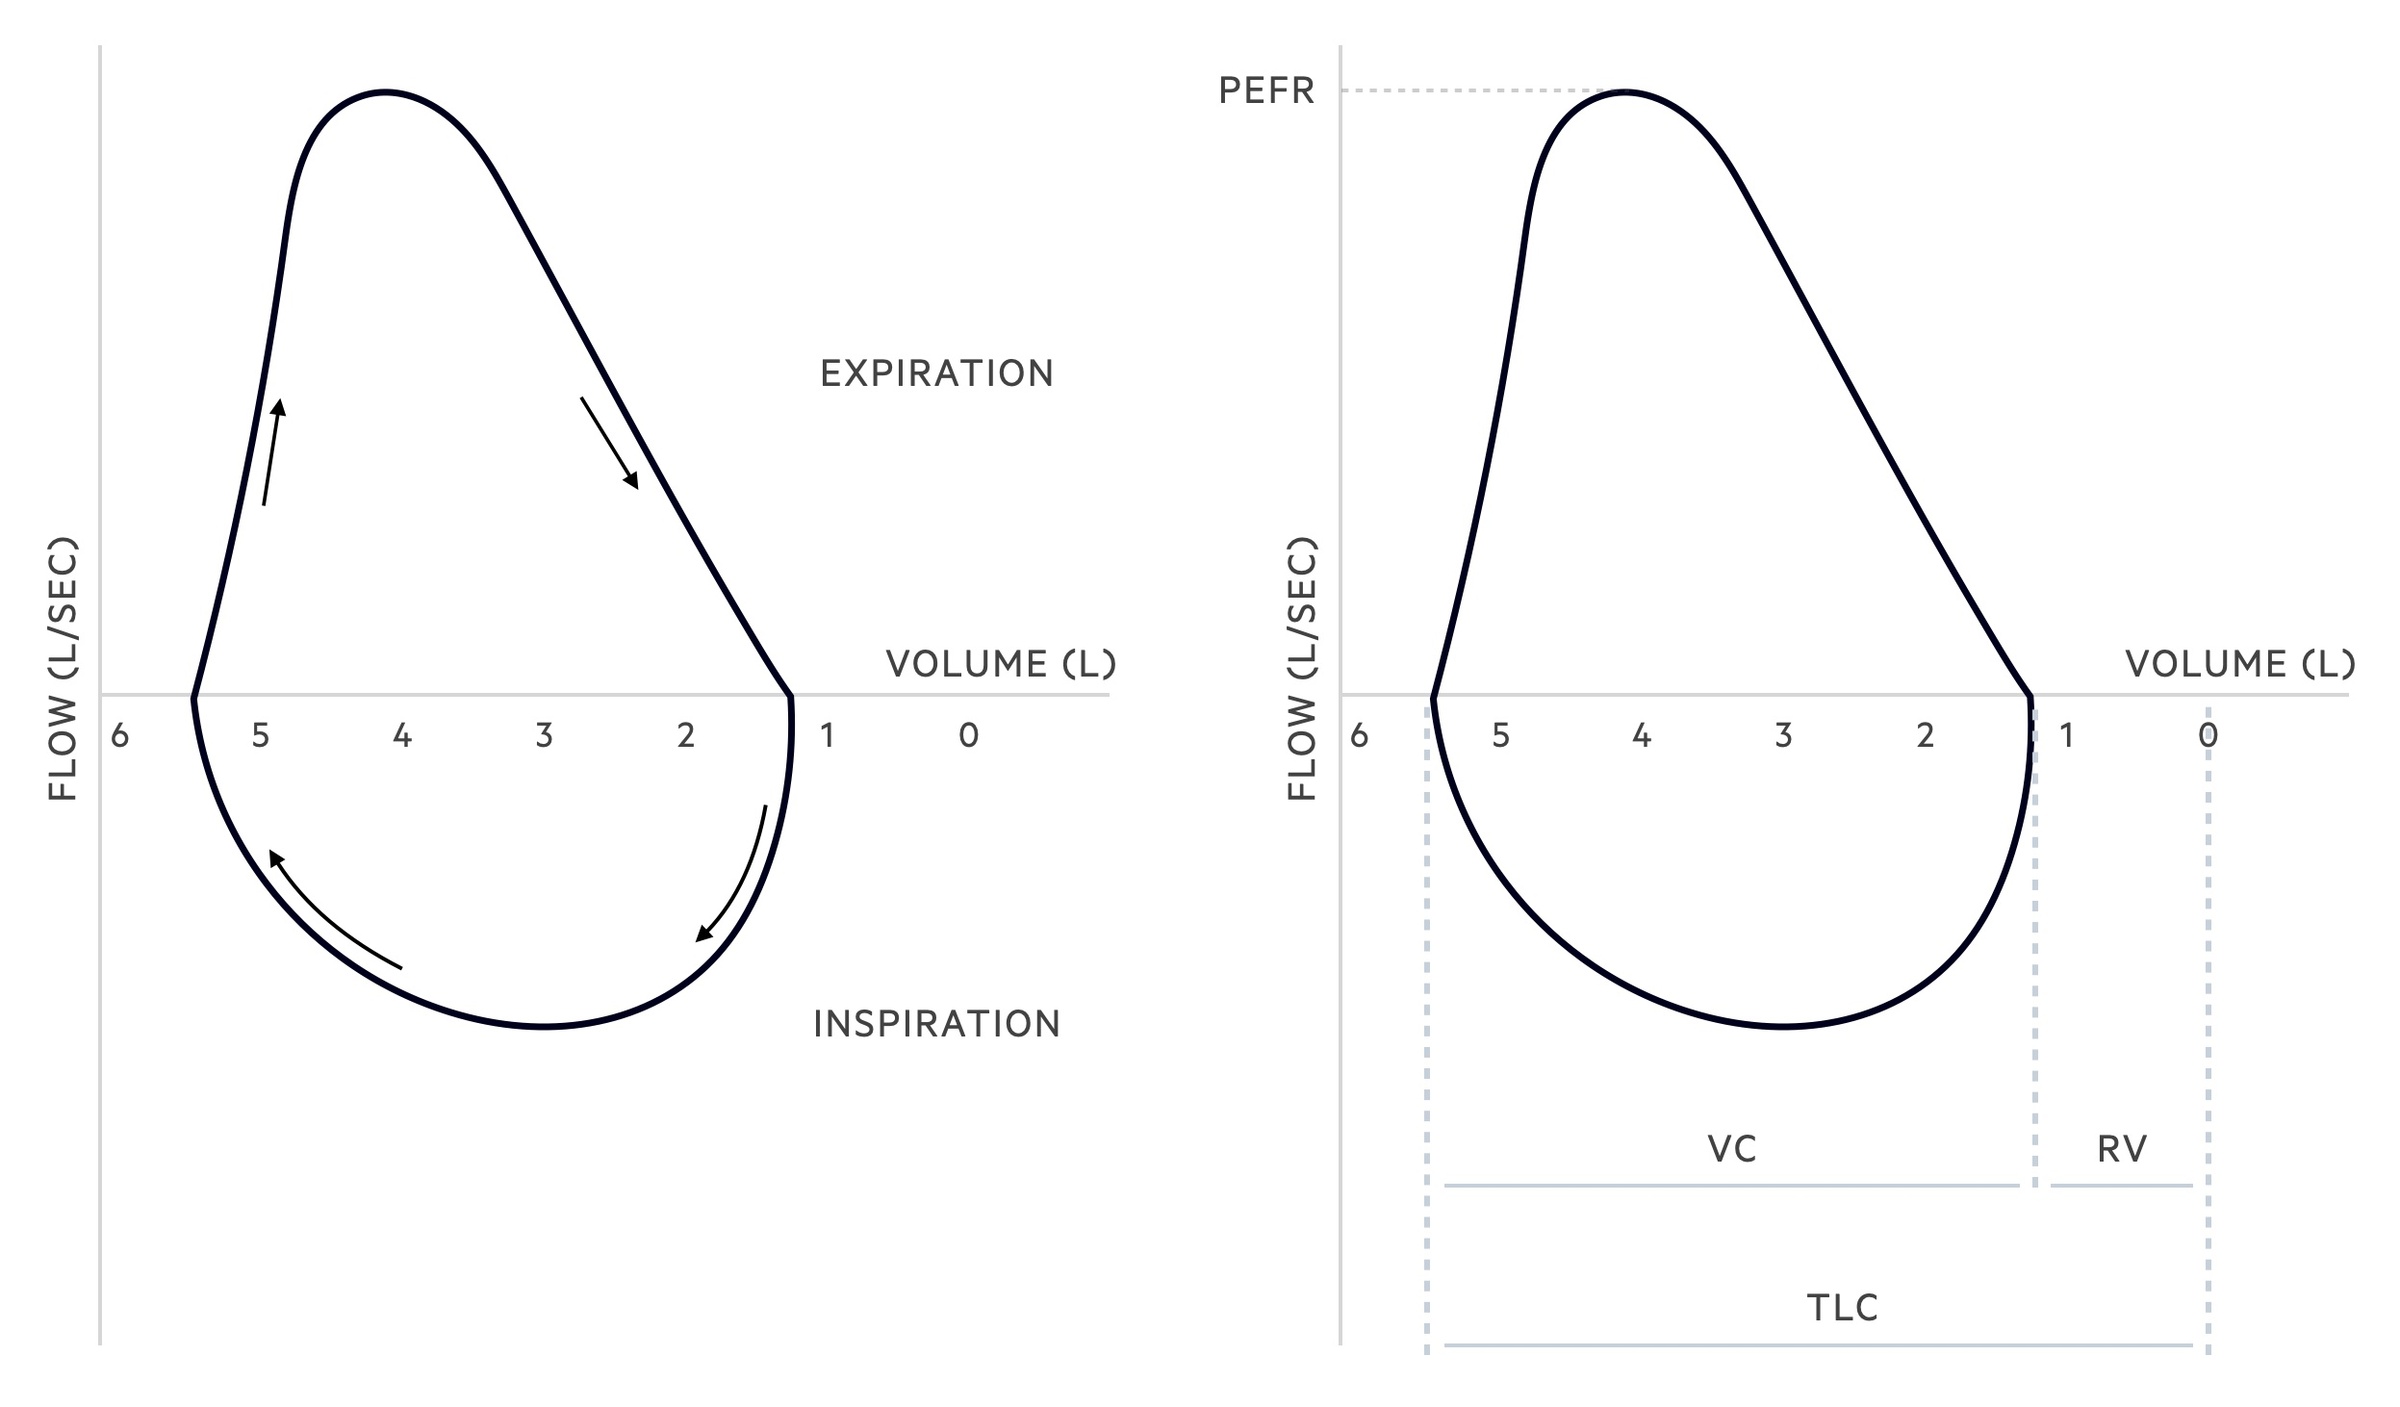
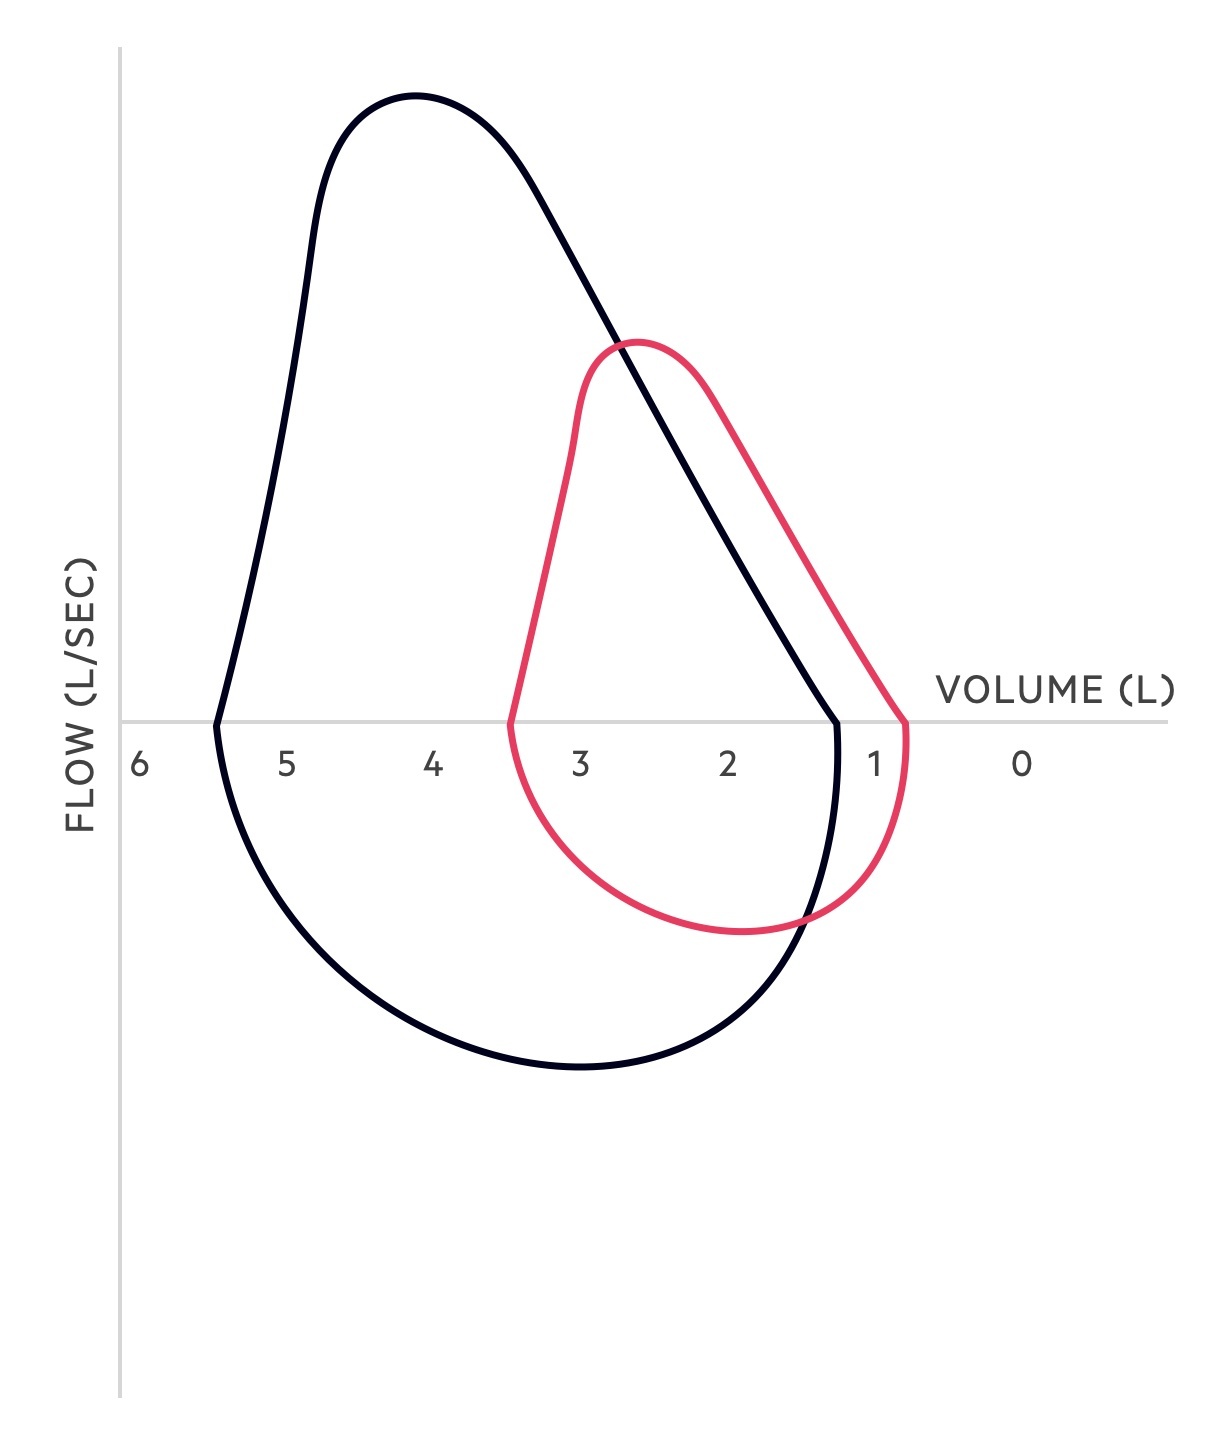
Flow-volume loop
A flow-volume loop plots the flow and volume changes that occur during inspiration and expiration.
Understanding flow-volume loops can be a little challenging at first. The x-axis acts as a dividing line and splits the two phases of breathing, inspiration and expiration, as flow reverses direction. In those with normal lung function (on maximal inspiration and expiration) the following pattern is seen:
- Inspiration: the flow and volume of the inspiratory phase are shown below the x-axis. As the patient takes a deep breath in, after maximal expiration, the graph forms a relatively symmetrical saddle-shaped curve as the flow rate of inspiration reaches a maximum before gradually falling. The curve runs from the residual volume (i.e. the volume left in the lungs after maximal expiration) to the total lung capacity (i.e. the total capacity of the lungs after maximal inspiration).
- Expiration: the flow and volume of the expiratory phase is shown above the x-axis. As the patient forcefully expires, after maximal inspiration, the graph rises to a peak (which represents the peak expiratory flow rate). It then shows a relatively linear fall (as the flow rate of expiration falls) until maximal expiration is achieved leaving only the residual volume. Flow then reverses and the inspiratory loop begins.
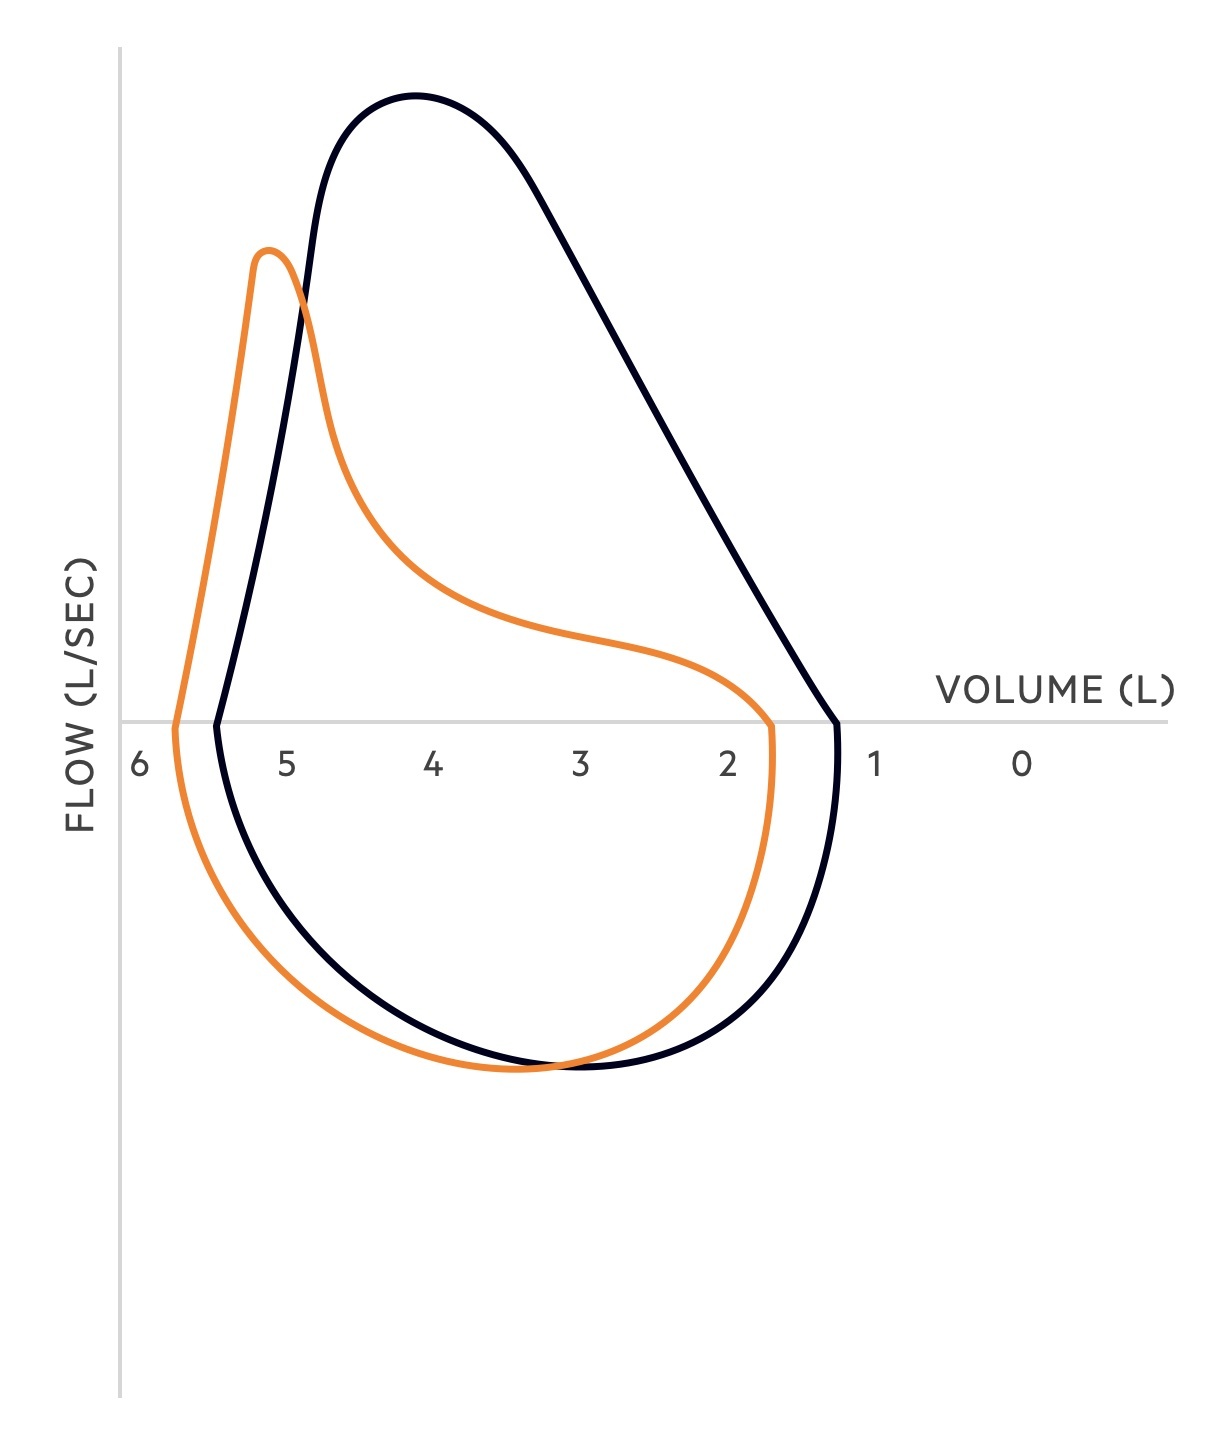
Obstructive lung disease
In obstructive lung disease, there is an increase in airway resistance and a decrease in the expiratory flow. Increased resistance may be secondary to airway inflammation and secretions, bronchospasm and/or reduced elastic recoil.
The pattern of the flow-volume loop changes in obstructive lung disease. The peak of the expiratory limb is lower (i.e. the PEFR is reduced) and the descending part of the expiratory limb is concave due to increased airway resistance and reduced recoil.
Total lung capacity is normal and may be increased, vital capacity may be reduced. In emphysematous disease, the residual volume may be increased due to trapping of air.
Restrictive lung disease
In restrictive diseases, the airways are not obstructed but lung capacity is limited. Elastic recoil may be increased causing supra-normal expiratory flow.
Total lung capacity and vital capacity are reduced. Residual volume may be normal but is frequently reduced.
Last updated: August 2021
Have comments about these notes? Leave us feedback