7. P wave, QRS & QT interval
Notes
Introduction
It is important we analyse each aspect of the ECG morphology including P wave, QRS complex, ST segment and T wave.
Abnormalities of the P wave, QRS complex, ST segment and T wave can tell us a lot about the patient. Analysing these parts of the ECG should always be taken in context of the rate, rhythm and clinical status of the patient.
Certain changes to the ECG morphology are classical of an underlying pathology. For example, ST elevation is the characteristic feature of an acute ST-elevation myocardial infarction (STEMI). Other changes are non-specific and can be suggestive of multiple pathologies. For example, T wave inversion may be a normal variant in certain leads, or associated with ischaemia, ventricular hypertrophy or pulmonary embolism (among others).
Here, we discuss problems with the P wave, QRS complex and QT interval.
P wave abnormalities
A P wave may be normal, abnormally tall, or unusually broad.
The P wave represents normal atrial electrical activity. As discussed in previous topics, ectopic electrical activity may result in an absence of P waves or abnormally shaped P waves. These can be considered rhythm-associated changes.
In the absence rhythm disturbances, P waves may be abnormally tall or unusually broad.
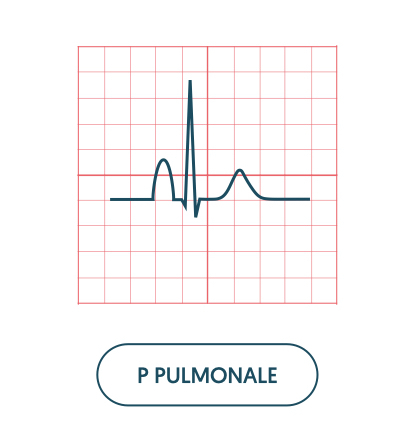
Tall P waves
Abnormally tall P waves are referred to as P pulmonale. P pulmonale occurs secondary to right atrial hypertrophy, which is usually secondary to pulmonary hypertension or tricuspid stenosis.
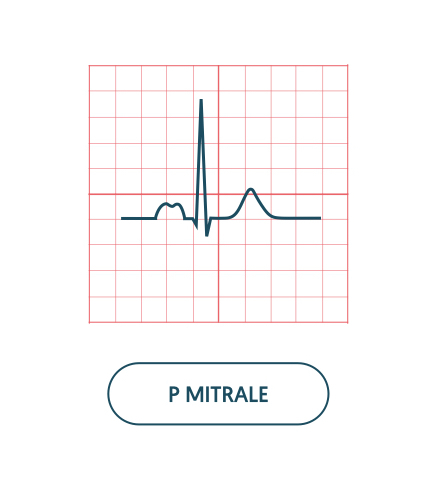
Broad P waves
Unusually broad P waves are referred to as P mitrale. On an ECG, it is seen as a bifid P wave with an ‘M’ like pattern. It is due left atrial hypertrophy, which is usually secondary to mitral stenosis.
QRS complex abnormalities
The QRS complex may be affected by ventricular muscle mass and conduction disturbances.
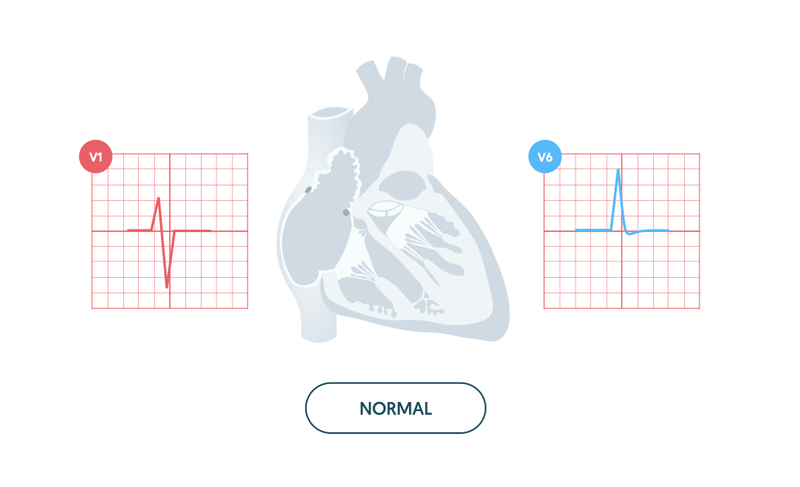
Normal QRS
The normal QRS complex is < 120 ms (3 small squares). The size of the R and S waves is dependent on the angle in which you view the heart. The S wave predominates (S > R) in the right ventricular leads (i.e. V1) and the R wave predominates (R size > S size) in the left ventricular leads (i.e. V5/V6).
Abnormalities in width
The width of the QRS complex can change due to problems with conduction (e.g. bundle branch block) or rhythm (e.g. ventricular tachycardia). In each of these cases, the width of the QRS complex increases (> 120 ms) due to depolarisation of the ventricles through a slower, abnormal pathway. For more information see our notes on Conduction and Rate & rhythm.
Abnormalities in height
The height, or size, of the QRS complex is largely dependent on the ventricular muscle mass. We call the increase in mass either right or left ventricular hypertrophy. Hypertrophy leads to an increase in electrical activity, which is seen as an increase in QRS complex height.
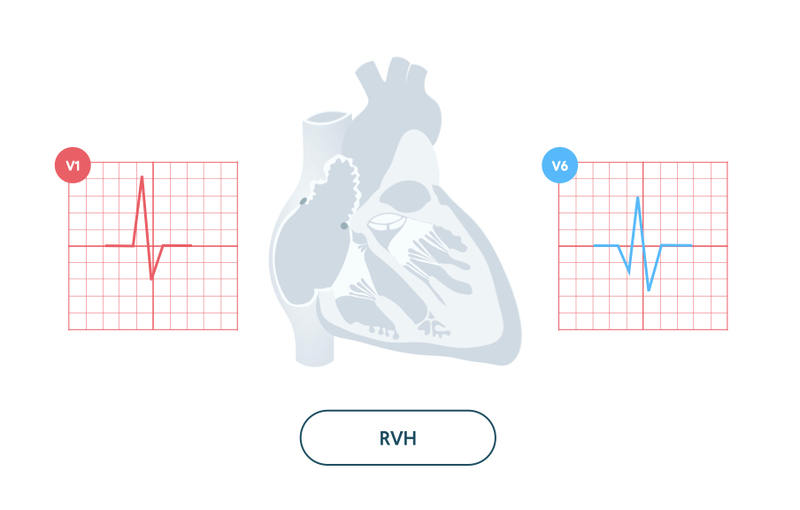
Right ventricular hypertrophy
Right ventricular hypertrophy (RVH) refers to abnormal enlargement of the right ventricle.
The increase in muscle mass has a profound influence on the electrical activity through the heart. This leads to a dominant R wave in the right ventricular lead V1 and a deep S wave in the left ventricular lead V6.
Causes:
- Pulmonary hypertension
- Chronic lung disease (cor pulmonale)
- Congenital heart disease
- Mitral stenosis
RVH is usually accompanied by other features on the ECG including right axis deviation, P pulmonale, and T wave inversion (V1-V4 plus inferior leads II, III, aVF).
Similar ECG features may be seen in acute pulmonary pathology (e.g. pulmonary embolism) leading to right ventricular strain. The classic ECG finding of acute right ventricular strain is S1Q3T3 (Deep S wave in lead I, Q wave in lead III and T wave inversion in lead III).
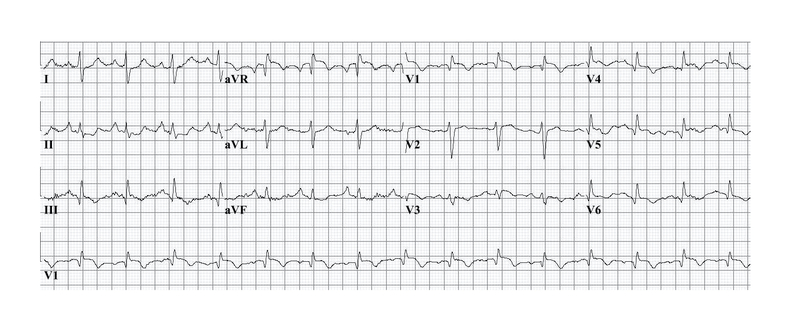
12-lead ECG showing classical S1Q3T3 pattern. Image courtesy of Wikimedia Commons.
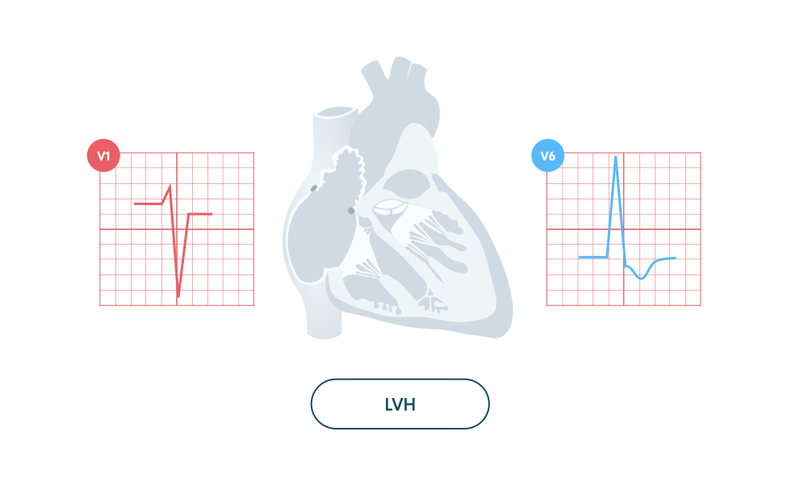
Left ventricular hypertrophy
Left ventricular hypertrophy (LVH) refers to abnormal enlargement of the left ventricle.
The increase in muscle mass has an even more profound effect on the electrical activity through the heart. This leads to a significant elevation in the height of the R wave in V5/V6 and depth of the S wave in V1/V2.
LVH is usually accompanied by other features on the ECG including T wave inversion and ST depression in the lateral leads (I, aVL, V5, V6). These changes are sometimes referred to as the ‘left ventricular strain pattern’.
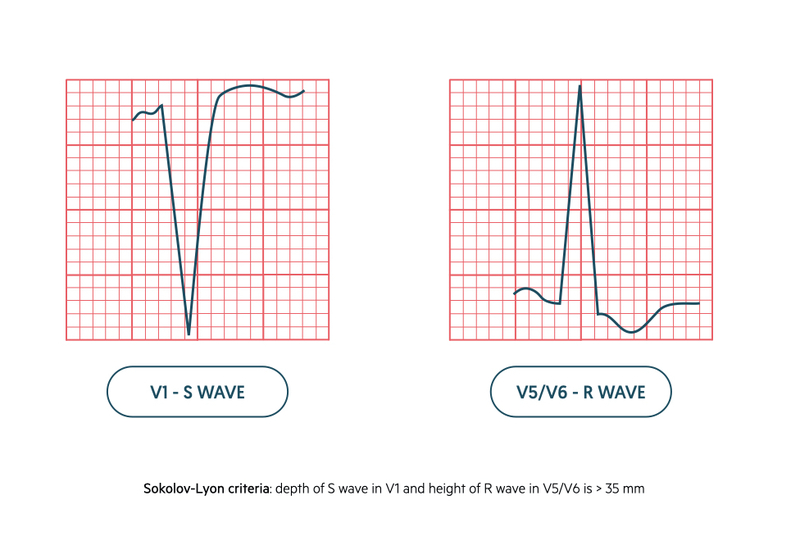
The diagnosis of LVH is usually based on the Sokolov-Lyon criteria. This is a voltage-based criteria that states LVH is present when the combined total of the depth of the S wave in V1 and height of R wave in V5/V6 is > 35mm.
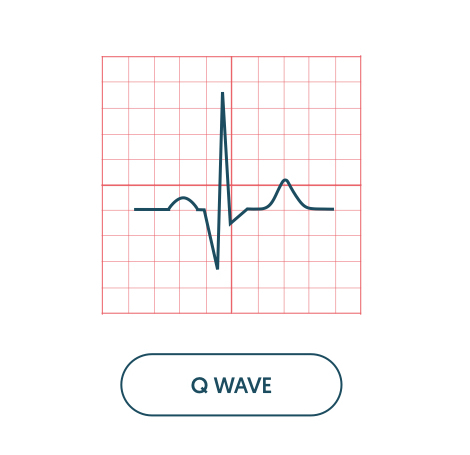
Q wave abnormalities
Q waves may be a normal finding due to septal depolarisation or indicate underlying ischaemia.
Q waves in the left ventricular leads (i.e. V5, V6) occur due to septal depolarisation. However, when Q waves appear greater than 40 ms (1 small square) in width, > 2 mm in depth and > 25% of the depth of QRS complex they are considered pathological. Q waves indicate previous or current myocardial infarction.
Q waves develop in ischaemia because of creation of an electrical window within the non-viable myocardium. They can suggest previous infarction but do not give an indication of age. Once Q waves have developed it is permanent.
- Inferior infarction: Q waves affecting leads II, III, aVF
- Anterior infarction: Q waves affecting leads V2-V5
- Lateral infarction: Q waves affecting leads V5-V6, I, aVL
NOTE: a posterior infarction is not associated with Q waves on a normal 12-lead ECG. In this type of myocardial infarction there is a dominant R wave in V1 similar to the findings in right ventricular hypertrophy.
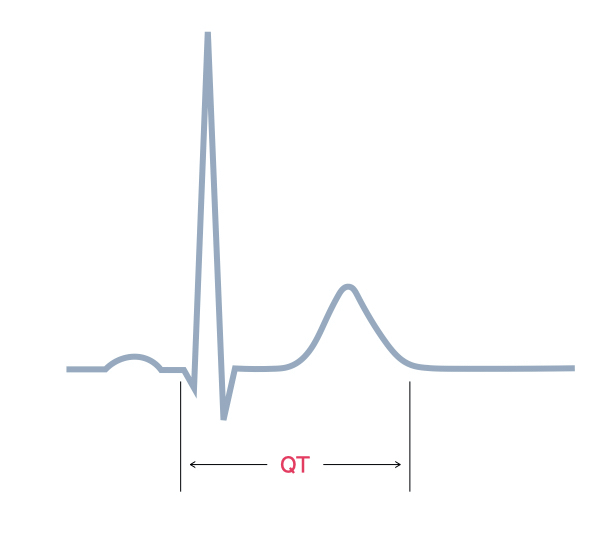
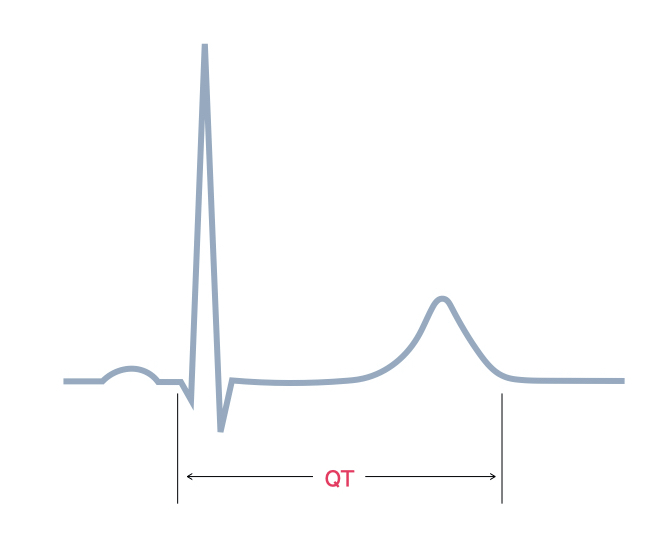
QT interval abnormalities
The QT interval describes the time between the start of the Q wave and end of the T wave.
The QT interval represents the total time taken for ventricular depolarisation and repolarisation.
The QT interval is affected by heart rate (lengthening with slow heart rates and shortening with fast heart rates). Consequently, the corrected QT interval (QTc), which estimates the QT interval at a standard heart rate, may be calculated using a number of different formulas. One such formula is the Bazett: QTc = QT / √RR.
The normal QTc is different for Men and Women:
- Men: 350 - 440 ms
- Women: 350 - 460 ms
If the QT interval is prolonged there is an increased risk of developing polymorphic VT (Torsades de pointes) and sudden death.
There are numerous causes of a prolonged QT interval which can be inherited or acquired.
- Long QT syndrome: inherited condition. Different subtypes based on genetic mutation. Dysfunction of cardiac ion channels causing slow ventricular repolarisation.
- Electrolytes: hypokalaemia, hypocalcaemia, hypomagnesaemia
- Cardiac disease: myocarditis, myocardial infarction
- Medications: many different types. Classic examples include anti-psychotics, anti-emetics and anti-arrhythmics. Always check individual drugs.
- Others: many other conditions including hypothyroidism and intracranial disease.
Last updated: January 2021
Have comments about these notes? Leave us feedback